### Describe Your Changes

This PR fixes an issue where the Downsampling filters debug page would
get stuck in an infinite loading state when labels had no matches. Now,
the case is properly handled.

Related issue: #8339

### Checklist

The following checks are **mandatory**:

- [x] My change adheres [VictoriaMetrics contributing
guidelines](https://docs.victoriametrics.com/contributing/).

---------

Signed-off-by: hagen1778 <roman@victoriametrics.com>
Co-authored-by: hagen1778 <roman@victoriametrics.com>
Legend settings have been added to **Graph Settings**.

#### **New Features:**
1. **Table View** – Toggle to display the legend in a table format.
2. **Hide Common Values** – Option to hide fields with identical values
across all series.
3. **Hide Min/Medium/Max** – Ability to hide min, median, and max values
from the legend.
4. **Custom Label Format** – Set a custom format for series labels
(applies only to the legend).
5. **Group by Label** – Group legend entries based on a selected label.


Related Issue:
https://github.com/VictoriaMetrics/VictoriaMetrics/issues/8031
### Describe Your Changes

This PR introduces several enhancements and optimizations for the Group
view:

1. **Disable hover effect:**
Add the option to disable the hover effect. This can help reduce CPU
load when viewing a large number of logs.

2. **Limit entries per Group:**
Add the ability to limit the number of records displayed per group. When
a limit is set, groups are rendered sequentially – the next group starts
only after the current group has finished. By default, there is no
limit.

3. **Display group info:**
Include the group number in the title along with the total count of
groups to improve clarity and navigation.

4. **Performance improvement:**
In addition to the features above, separate optimizations reduce CPU
load during hover interactions by approximately 5-10%.

Related issue: #8135


<details>
  <summary>Demo UI</summary>

<img
src="https://github.com/user-attachments/assets/9c89066e-28af-4df2-b368-2380412b3c3f"/>
<img
src="https://github.com/user-attachments/assets/a2338c8d-558c-437c-969e-f825043eb35b"/>

</details>

### Checklist

The following checks are **mandatory**:

- [ ] My change adheres [VictoriaMetrics contributing
guidelines](https://docs.victoriametrics.com/contributing/).

---------

Co-authored-by: Aliaksandr Valialkin <valyala@victoriametrics.com>
### Describe Your Changes

Fix autocomplete not passing `AccountID` and `ProjectID` headers when
fetching suggestions in VictoriaLogs UI.

Related: #8042

### Checklist

The following checks are **mandatory**:

- [ ] My change adheres [VictoriaMetrics contributing
guidelines](https://docs.victoriametrics.com/contributing/).

---------

Signed-off-by: hagen1778 <roman@victoriametrics.com>
Co-authored-by: hagen1778 <roman@victoriametrics.com>
### Describe Your Changes

Updated default `step` calculation for `Table` and `JSON` views.

- When switching to the `Table` or `JSON` view, the default step is now
automatically set to `end - start`, where `end` and `start` correspond
to the selected time range.
- If the user has manually set a step value, it will remain unchanged
when switching views or changing the time range.
- The UI now explicitly indicates when the step is automatically
calculated.

<details> <summary>Demo</summary>


https://github.com/user-attachments/assets/2540de24-36ed-4764-a047-1c6b48a80ed4

</details>

**Note:** These views use the
[`/api/v1/query`](https://docs.victoriametrics.com/keyconcepts/#instant-query)
endpoint for instant queries.

Related issue: #8240


### Checklist

The following checks are **mandatory**:

- [x] My change adheres [VictoriaMetrics contributing
guidelines](https://docs.victoriametrics.com/contributing/).

---------

Signed-off-by: hagen1778 <roman@victoriametrics.com>
Co-authored-by: hagen1778 <roman@victoriametrics.com>
### Describe Your Changes

- Migrated build process from Webpack (CRA) to Vite
Reason for migration: `create-react-app` has been
[deprecated](b532a58792)
and contains outdated dependencies that haven’t been updated for over
two years, leading to security vulnerabilities. Additionally, build
speed improved by more than 2x.
- Updated dependencies and fixed TypeScript typings in accordance with
the updates


b532a58792

### Checklist

The following checks are **mandatory**:

- [ ] My change adheres [VictoriaMetrics contributing
guidelines](https://docs.victoriametrics.com/contributing/).
### Describe Your Changes

Fixed an issue where dropdown menus were not visible in the Group View
settings.
Ref issue: #8153

### Checklist

The following checks are **mandatory**:

- [ ] My change adheres [VictoriaMetrics contributing
guidelines](https://docs.victoriametrics.com/contributing/).

---------

Signed-off-by: hagen1778 <roman@victoriametrics.com>
Co-authored-by: hagen1778 <roman@victoriametrics.com>
### Describe Your Changes

- Added the `fields_limit` parameter for the `hits` query to limit the
number of returned fields. This reduces the response size and decreases
memory usage.

#### Legend Menu:
A context menu has been added for legend items, which includes:
1. Metric name
2. **Copy _stream name** - copies the full stream name in the format
`{field1="value1", ..., fieldN="valueN"}`.
3. **Add _stream to filter** - adds the full stream value to the current
filter:
   `_stream: {field1="value1", ..., fieldN="valueN"} AND (old_expr)`.
4. **Exclude _stream from filter** - excludes the stream from the
current filter:
`(NOT _stream: {field1="value1", ..., fieldN="valueN"}) AND (old_expr)`.
5. List of fields with options:
   - Copy as `field: "value"`.
   - Add to filter: `field: "value" AND (old_expr)`.
   - Exclude from filter: `-field: "value" AND (old_expr)`.
6. Total number of hits for the stream.

Related issue: #7552

<details>
  <summary>UI Demo - Legend Menu</summary>

<img width="400"
src="https://github.com/user-attachments/assets/ee1954b2-fdce-44b4-a2dc-aa73096a5414"/>
<img width="400"
src="https://github.com/user-attachments/assets/19d71f04-c207-4143-a176-c5f221592e3d"/>

</details>

---

#### Legend:
1. Displays the total number of hits for the stream.
2. Added hints below the legend for total hits and graph interactions.
3. Click behavior is now the same as in other vmui charts:
   - `click` - shows only the selected series.
   - `click + ctrl/cmd` - hides the selected series.

<details>
  <summary>UI Demo - Legend</summary>

before:
<img
src="https://github.com/user-attachments/assets/18270842-0c39-4f63-bcda-da62e15c3c73"/>

after:
<img
src="https://github.com/user-attachments/assets/351cad3a-f763-4b1d-b3be-b569b5472a7c"/>

</details>

---

#### Tooltip:
1. The `other` label is moved to the end, and others are sorted by
value.
2. Values are aligned to the right.
3. Labels are truncated and always shown in a single line for better
readability; the full name is available in the legend.

<details>
  <summary>UI Demo - Tooltip</summary>

| before     | after        |
|----------|----------|
| <img
src="https://github.com/user-attachments/assets/adccff38-e2e6-46e4-a69e-21381982489c"/>
| <img
src="https://github.com/user-attachments/assets/81008897-d816-4aed-92cb-749ea7e0ff1e"/>
|

</details>

---

#### Group View (tab Group):
Groups are now sorted by the number of records in descending order.

<details>
  <summary>UI Demo - Group View</summary>

before:
<img width="800"
src="https://github.com/user-attachments/assets/15b4ca72-7e5d-421f-913b-c5ff22c340cb"/>

after:
<img width="800"
src="https://github.com/user-attachments/assets/32ff627b-6f30-4195-bfe7-8c9b4aa11f6b"/>

</details>
### Describe Your Changes

Added saving column settings in the URL for the table view. See #7662

---------

Signed-off-by: hagen1778 <roman@victoriametrics.com>
Co-authored-by: hagen1778 <roman@victoriametrics.com>
This commit fixes incorrect behaviour when pressing `Enter` did not execute the query, and
`Shift+Enter` did not insert a new line.

- The issue occurred when autocomplete was disabled.
- This problem affected the query editor in both the VictoriaMetrics UI
and VictoriaLogs UI.

Related issue:
https://github.com/VictoriaMetrics/VictoriaMetrics/issues/8058
### Describe Your Changes

This pull request adds support for autocomplete in LogsQL queries. The
new feature provides suggestions for field names, field values, and pipe
names as you type.


---------

Co-authored-by: Aliaksandr Valialkin <valyala@victoriametrics.com>
See https://alpinelinux.org/posts/Alpine-3.21.0-released.html

### Describe Your Changes

Please provide a brief description of the changes you made. Be as
specific as possible to help others understand the purpose and impact of
your modifications.

### Checklist

The following checks are **mandatory**:

- [ ] My change adheres [VictoriaMetrics contributing
guidelines](https://docs.victoriametrics.com/contributing/).

Signed-off-by: hagen1778 <roman@victoriametrics.com>
### Describe Your Changes

- Fixes the handling of the `showLegend` flag.
- Fixes the handling of `alias`.
- Adds support for alias templates, allowing dynamic substitutions like
`{{label_name}}`.

Related issue:
https://github.com/VictoriaMetrics/VictoriaMetrics/issues/7565
### Describe Your Changes

- **Memory Optimization**: Reduced memory consumption on the "Group" and
"JSON" tabs by approximately 30%.

- **Table Pagination**: Added pagination to the "Table" view with an
option to select the number of rows displayed (from 10 to 1000 items per
page, with a default of 1000). This change significantly reduced memory
usage by approximately 75%.

Related to #7185

### Checklist

The following checks are **mandatory**:

- [ ] My change adheres [VictoriaMetrics contributing
guidelines](https://docs.victoriametrics.com/contributing/).

---------

Co-authored-by: Roman Khavronenko <roman@victoriametrics.com>
### Describe Your Changes

1. **Add new `Raw Query` tab**
A new `Raw Query` tab has been added to the
[vmui](https://docs.victoriametrics.com/#vmui) interface for displaying
raw data. The tab uses the `/api/v1/export` API endpoint. Related issue:
[#7024](https://github.com/VictoriaMetrics/VictoriaMetrics/issues/7024)


2. **Fix rendering of isolated points on the graph**
Previously, isolated points (not connected to other points on the left
or right) were not visible on the graph. Now, they are rendered
correctly.


### Checklist

The following checks are **mandatory**:

- [ ] My change adheres [VictoriaMetrics contributing
guidelines](https://docs.victoriametrics.com/contributing/).

---------

Co-authored-by: Roman Khavronenko <roman@victoriametrics.com>
### Describe Your Changes

add sorting of logs by groups and within each group by time in desc
order. See #7184 and #7045

### Checklist

The following checks are **mandatory**:

- [ ] My change adheres [VictoriaMetrics contributing
guidelines](https://docs.victoriametrics.com/contributing/).

Co-authored-by: Aliaksandr Valialkin <valyala@victoriametrics.com>
### Describe Your Changes

Fixes issues with incorrect updating of query and limit fields, and
resolves the problem where the display tab resets.

Related issue: #7279 and #7290

### Checklist

The following checks are **mandatory**:

- [ ] My change adheres [VictoriaMetrics contributing
guidelines](https://docs.victoriametrics.com/contributing/).

---------

Signed-off-by: hagen1778 <roman@victoriametrics.com>
Co-authored-by: Zakhar Bessarab <z.bessarab@victoriametrics.com>
### Describe Your Changes
**Added ability to hide the hits chart**
- Users can now hide or show the hits chart by clicking the "eye" icon
located in the upper-right corner of the chart.
- When the chart is hidden, it will stop sending requests to
`/select/logsql/hits`.
- Upon displaying the chart again, it will automatically refresh. If a
relative time range is set, the chart will update according to the time
period of the logs currently being displayed.
**Hits chart visible:**
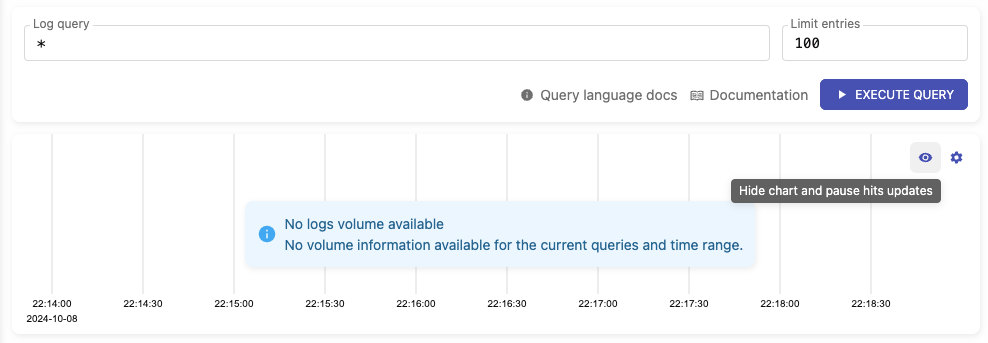
**Hits chart hidden:**

Related issue: #7117
### Checklist
The following checks are **mandatory**:
- [ ] My change adheres [VictoriaMetrics contributing
guidelines](https://docs.victoriametrics.com/contributing/).
Co-authored-by: Aliaksandr Valialkin <valyala@victoriametrics.com>
### Describe Your Changes

Fixed the display of hits chart in VictoriaLogs.
See #7133

### Checklist

The following checks are **mandatory**:

- [ ] My change adheres [VictoriaMetrics contributing
guidelines](https://docs.victoriametrics.com/contributing/).
### Describe Your Changes

Please provide a brief description of the changes you made. Be as
specific as possible to help others understand the purpose and impact of
your modifications.

### Checklist

The following checks are **mandatory**:

- [ ] My change adheres [VictoriaMetrics contributing
guidelines](https://docs.victoriametrics.com/contributing/).

Signed-off-by: hagen1778 <roman@victoriametrics.com>
### Describe Your Changes

Fix `Alert` component to prevent it from overflowing the screen when
displaying long messages.

Related issue: #7207

### Checklist

The following checks are **mandatory**:

- [x] My change adheres [VictoriaMetrics contributing
guidelines](https://docs.victoriametrics.com/contributing/).

---------

Signed-off-by: Zakhar Bessarab <z.bessarab@victoriametrics.com>
Signed-off-by: hagen1778 <roman@victoriametrics.com>
Co-authored-by: hagen1778 <roman@victoriametrics.com>
### Describe Your Changes
- Added functionality to cancel running queries on the Explore Logs and
Query pages.
- The loader was changed from a spinner to a top bar within the block.
This still indicates loading, but solves the issue of the spinner
"flickering," especially during graph dragging.
Related issue: #7097https://github.com/user-attachments/assets/98e59aeb-905b-4b9d-bbb2-688223b22a82
### Checklist
The following checks are **mandatory**:
- [ ] My change adheres [VictoriaMetrics contributing
guidelines](https://docs.victoriametrics.com/contributing/).
### Describe Your Changes

Related issue: #7142

### Checklist

The following checks are **mandatory**:

- [x] My change adheres [VictoriaMetrics contributing
guidelines](https://docs.victoriametrics.com/contributing/).
### Describe Your Changes

- Show the time range in the tooltip when hovering over staircase
graphs.
- Use bolder lines for staircase graphs.
- Increase the number of steps on the staircase graph to 100.
- Reduce the maximum width of the tooltip to 1/3 of the screen.
- Insert only the label name under the cursor into the query input field
when `Ctrl`-clicking the line legend.

See [this
comment](https://github.com/VictoriaMetrics/VictoriaMetrics/issues/6545#issuecomment-2336805237).

### Checklist

The following checks are **mandatory**:

- [ ] My change adheres [VictoriaMetrics contributing
guidelines](https://docs.victoriametrics.com/contributing/).

---------

Co-authored-by: Aliaksandr Valialkin <valyala@victoriametrics.com>
### Describe Your Changes

1) Changed table settings from a popup to a modal window to simplify
future functionality additions.
2) Added functionality to save selected columns when data is modified or
the page is reloaded. See #7016.

<details>
  <summary>Example screenshots</summary>

<img alt="demo-1" width="600"
src="https://github.com/user-attachments/assets/a5d9a910-363c-4931-8b12-18ea8b3d97d8"/>

</details>


### Checklist

The following checks are **mandatory**:

- [x] My change adheres [VictoriaMetrics contributing
guidelines](https://docs.victoriametrics.com/contributing/).

---------

Co-authored-by: Roman Khavronenko <roman@victoriametrics.com>