### Describe Your Changes

- **Memory Optimization**: Reduced memory consumption on the "Group" and
"JSON" tabs by approximately 30%.

- **Table Pagination**: Added pagination to the "Table" view with an
option to select the number of rows displayed (from 10 to 1000 items per
page, with a default of 1000). This change significantly reduced memory
usage by approximately 75%.

Related to #7185

### Checklist

The following checks are **mandatory**:

- [ ] My change adheres [VictoriaMetrics contributing
guidelines](https://docs.victoriametrics.com/contributing/).

---------

Co-authored-by: Roman Khavronenko <roman@victoriametrics.com>
By default the delay equals to 1 second.

While at it, document refresh_interval query arg at /select/logsql/tail endpoint.

Thanks to @Fusl for the idea and the initial implementation at https://github.com/VictoriaMetrics/VictoriaMetrics/pull/7428
### Describe Your Changes

add sorting of logs by groups and within each group by time in desc
order. See #7184 and #7045

### Checklist

The following checks are **mandatory**:

- [ ] My change adheres [VictoriaMetrics contributing
guidelines](https://docs.victoriametrics.com/contributing/).

Co-authored-by: Aliaksandr Valialkin <valyala@victoriametrics.com>
Loki protocol supports optional `metadata` object for each ingested line. It's added as 3rd field at the (ts,msg,metadata) tuple. Previously,  loki request json parsers rejected log line if tuple size != 2.

This commit allows optional tuple field. It parses it as json object and adds it as log metadata fields to the  log message stream.


related issue:
https://github.com/VictoriaMetrics/VictoriaMetrics/issues/7431

---------
Co-authored-by: f41gh7 <nik@victoriametrics.com>
### Describe Your Changes

Christmas is early and you get the first present in the shape of
spelling fixes.
Sorry for the big amount :)

### Checklist

- [x] My change adheres [VictoriaMetrics contributing
guidelines](https://docs.victoriametrics.com/contributing/).
In this case the _msg field is set to the value specified in the -defaultMsgValue command-line flag.

This should simplify first-time migration to VictoriaLogs from other systems.
This msy be useful when ingesting logs from different sources, which store the log message in different fields.
For example, `_msg_field=message,event.data,some_field` will get log message from the first non-empty field:
`message`, `event.data` and `some_field`.
If the number of output (bloom, values) shards is zero, then this may lead to panic
as shown at https://github.com/VictoriaMetrics/VictoriaMetrics/issues/7391 .

This panic may happen when parts with only constant fields with distinct values are merged into
output part with non-constant fields, which should be written to (bloom, values) shards.
This allows reducing the amounts of data, which must be read during queries over logs with big number of fields (aka "wide events").
This, in turn, improves query performance when the data, which needs to be scanned during the query, doesn't fit OS page cache.
This improves performance of `field_values` pipe when it is applied to large number of data blocks.
This also improves performance of /select/logsql/field_values HTTP API.
### Describe Your Changes

Fixes issues with incorrect updating of query and limit fields, and
resolves the problem where the display tab resets.

Related issue: #7279 and #7290

### Checklist

The following checks are **mandatory**:

- [ ] My change adheres [VictoriaMetrics contributing
guidelines](https://docs.victoriametrics.com/contributing/).

---------

Signed-off-by: hagen1778 <roman@victoriametrics.com>
Co-authored-by: Zakhar Bessarab <z.bessarab@victoriametrics.com>
### Describe Your Changes
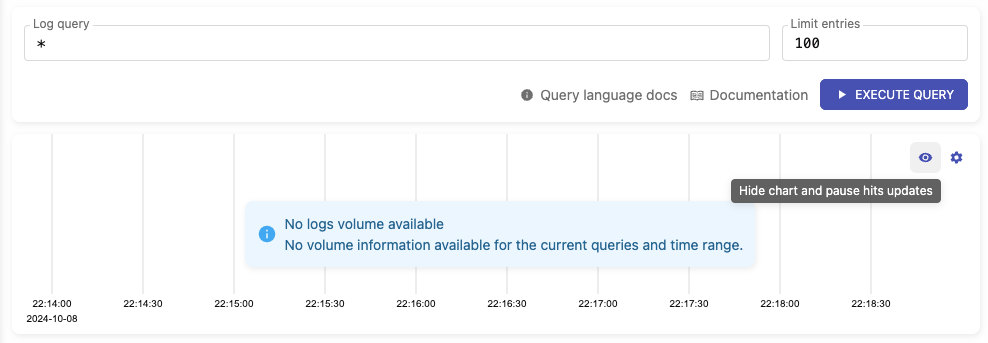
**Added ability to hide the hits chart**
- Users can now hide or show the hits chart by clicking the "eye" icon
located in the upper-right corner of the chart.
- When the chart is hidden, it will stop sending requests to
`/select/logsql/hits`.
- Upon displaying the chart again, it will automatically refresh. If a
relative time range is set, the chart will update according to the time
period of the logs currently being displayed.
**Hits chart visible:**

**Hits chart hidden:**

Related issue: #7117
### Checklist
The following checks are **mandatory**:
- [ ] My change adheres [VictoriaMetrics contributing
guidelines](https://docs.victoriametrics.com/contributing/).
Co-authored-by: Aliaksandr Valialkin <valyala@victoriametrics.com>
### Describe Your Changes

Fixed the display of hits chart in VictoriaLogs.
See #7133

### Checklist

The following checks are **mandatory**:

- [ ] My change adheres [VictoriaMetrics contributing
guidelines](https://docs.victoriametrics.com/contributing/).
Unpack the full columnsHeader block instead of unpacking meta-information per each individual column
when the query, which selects all the columns, is executed. This improves performance when scanning
logs with big number of fields.