 ## Node-Exporter
> **Note: Preset assets can be also found [here](https://github.com/VictoriaMetrics/VictoriaMetrics/tree/master/deployment/docker/vmanomaly/vmanomaly-node-exporter-preset/)**
For enabling Node-Exporter in config file use `preset` parameter:
```yaml
preset: "node-exporter"
```
### Generated anomaly scores
Machine learning models will be fit for each timeseries, returned by underlying [MetricsQL](https://docs.victoriametrics.com/metricsql/) queries.
Anomaly score metric labels will also contain [model classes](/anomaly-detection/components/models/) and [schedulers](/anomaly-detection/components/scheduler/) for labelset uniqueness.
Here's an example of produced metrics:
```shell
anomaly_score{for="cpu_seconds_total", instance="node-exporter:9100", preset="node-exporter", mode="system", model_alias="prophet", scheduler_alias="1d_1m"} 0.23451242720277776
anomaly_score{for="cpu_seconds_total", instance="node-exporter:9100", preset="node-exporter", mode="user", model_alias="prophet", scheduler_alias="1d_1m"} 0.2637952255694444
anomaly_score{for="page_faults", instance="node-exporter:9100", job="node-exporter", preset="node-exporter", model_alias="prophet", scheduler_alias="1d_1m"} 0.00593712535
anomaly_score{for="read_latency", instance="node-exporter:9100", preset="node-exporter", model_alias="mad", scheduler_alias="1d_1m"} 0.27773362795333334
anomaly_score{for="receive_bytes", instance="node-exporter:9100", preset="node-exporter", model_alias="mad", scheduler_alias="1d_1m"} 0.037753486136666674
anomaly_score{for="transmit_bytes", instance="node-exporter:9100", preset="node-exporter", model_alias="mad", scheduler_alias="1d_1m"} 0.17633085235
anomaly_score{for="write_latency", instance="node-exporter:9100", preset="node-exporter", model_alias="mad", scheduler_alias="1d_1m"} 0.019314370926666668
anomaly_score{for="cpu_seconds_total", instance="node-exporter:9100", preset="node-exporter", mode="idle", model_alias="mad", scheduler_alias="1d_1m"} 4.2323617935
anomaly_score{for="cpu_seconds_total", instance="node-exporter:9100", preset="node-exporter", mode="idle", model_alias="mad", scheduler_alias="2w_1m"} 1.5261359215
anomaly_score{for="cpu_seconds_total", instance="node-exporter:9100", preset="node-exporter", mode="idle", model_alias="prophet", scheduler_alias="2w_1m"} 0.5850743651
anomaly_score{for="cpu_seconds_total", instance="node-exporter:9100", preset="node-exporter", mode="idle", model_alias="z-score", scheduler_alias="1d_1m"} 1.6496064663
anomaly_score{for="cpu_seconds_total", instance="node-exporter:9100", preset="node-exporter", mode="idle", model_alias="z-score", scheduler_alias="2w_1m"} 0.924392581
anomaly_score{for="cpu_seconds_total", instance="node-exporter:9100", preset="node-exporter", mode="iowait", model_alias="mad", scheduler_alias="1d_1m"} 0.8571428657
...
```
### Alerts
> For optimal alerting experience, we include [Awesome alerts](https://github.com/samber/awesome-prometheus-alerts) to cover indicators not addressed by the preset, as static thresholds can effectively complement our machine learning approach.
> Provided `vmanomaly` alerts are set to fire only if *all anomaly detection models* vote that the datapoint is anomalous.
You can find corresponding alerting rules here:
- `vmanomaly` [Anomaly Detection alerts](https://github.com/VictoriaMetrics/VictoriaMetrics/tree/master/deployment/docker/vmanomaly/vmanomaly-node-exporter-preset/vmanomaly_alerts.yml): `http://localhost:8490/presets/vmanomaly_alerts.yml`
- [Modified Awesome Alerts](https://github.com/VictoriaMetrics/VictoriaMetrics/tree/master/deployment/docker/vmanomaly/vmanomaly-node-exporter-preset/awesome_alerts.yml): `http://localhost:8490/presets/awesome_alerts.yml`
#### Awesome Alerts replaced by Machine Learning alerts
- HostMemoryUnderMemoryPressure
- HostContextSwitching
- HostHighCpuLoad
- HostCpuIsUnderutilized
- HostCpuStealNoisyNeighbor
- HostCpuHighIowait
- HostNetworkReceiveErrors
- HostNetworkTransmitErrors
- HostUnusualNetworkThroughputIn
- HostUnusualNetworkThroughputOut
### Grafana dashboard
Grafana dashboard `.json` file can be found [here](https://github.com/VictoriaMetrics/VictoriaMetrics/tree/master/deployment/docker/vmanomaly/vmanomaly-node-exporter-preset/dashboard.json): `http://localhost:8490/presets/dashboard.json`
### Indicators monitored by preset
The produced anomaly scores will have a label `for` containing the name of corresponding indicator.
| Indicator | Based on metrics | Description |
|---|---|---|
page_faults |
node_vmstat_pgmajfault |
Number of major faults that have occurred since the last update. Major faults occur when a process tries to access a page in memory that is not currently mapped in the process's address space, and it requires loading data from the disk. |
context_switch |
node_context_switches_total |
This metric represents the total number of context switches across all CPUs. |
cpu_seconds_total |
node_cpu_seconds_total |
Total amount of CPU time consumed by the system in seconds by CPU processing mode (e.g., user, system, idle). |
host_network_receive_errors & host_network_transmit_errors |
node_network_receive_errs_total, node_network_receive_packets_total, node_network_transmit_errs_total, node_network_transmit_packets_total
| Total number of errors encountered while receiving/transmitting packets on the network interfaces of a node. |
receive_bytes & transmit_bytes |
node_network_receive_bytes_total, node_network_transmit_bytes_total |
Total number of bytes received/transmitted on network interfaces of a node. |
read_latency & write_latency |
node_disk_read_time_seconds_total, node_disk_reads_completed_total, node_disk_write_time_seconds_total, node_disk_writes_completed_total |
Disk latency. The total read/write time spent in seconds. / The total number of reads/writes completed successfully. |
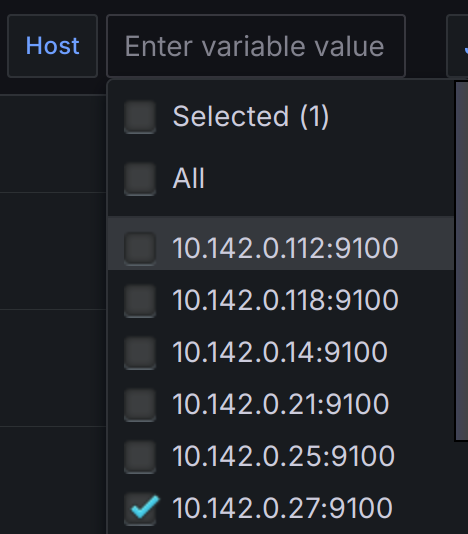
 At this timestamp on the **'Number of Anomalous Indicators by Node'** graph we can identify the node that had the most anomalies: `10.142.0.27`
 Now you can select anomalous node to drill down further (local):
 For this node from the timestamp `2024-06-03 10:35:00` CPU time spent handling software interrupts started to grow.
(`cpu_seconds_total{mode="softirq"}`)
 At the same time `cpu_seconds_total` for `steal` mode started to grow as well.
