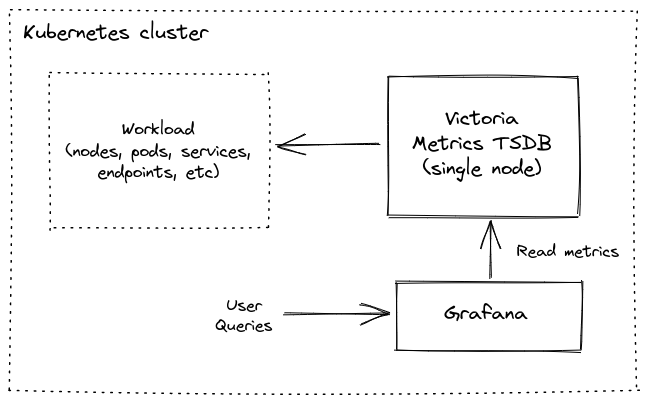
# Kubernetes monitoring with VictoriaMetrics Single
**This guide covers:**
* The setup of VictoriaMetrics single node in Kubernetes via helm charts
* How to store metrics
* How to scrape metrics from k8s components using service discovery
* How to Visualize stored data
**Precondition**
We will use:
* [Kubernetes cluster 1.19.10-gke.1600](https://cloud.google.com/kubernetes-engine)
> We use GKE cluster from GCP but feel free to use any kubernetes setup eg [Amazon EKS](https://aws.amazon.com/ru/eks/)
* [helm 3 ](https://helm.sh/docs/intro/install)
* [kubectl 1.21](https://kubernetes.io/docs/tasks/tools/install-kubectl)
**1. VictoriaMetrics helm repository**
> For this guide we will use helm 3 but if you already use helm 2 please see this [https://github.com/VictoriaMetrics/helm-charts#for-helm-v2](https://github.com/VictoriaMetrics/helm-charts#for-helm-v2)
You need to add the VictoriaMetrics helm repository to install VictoriaMetrics components. We’re going to use VictoriaMetrics single-node. You can do this by running the following command:
```bash
helm repo add vm https://victoriametrics.github.io/helm-charts/
```
Update helm repositories:
```bash
helm repo update
```
To verify that everything is set up correctly you may run this command:
```bash
helm search repo vm/
```
The expected output is:
```bash
NAME CHART VERSION APP VERSION DESCRIPTION
vm/victoria-metrics-agent 0.7.20 v1.62.0 Victoria Metrics Agent - collects metrics from ...
vm/victoria-metrics-alert 0.3.34 v1.62.0 Victoria Metrics Alert - executes a list of giv...
vm/victoria-metrics-auth 0.2.23 1.62.0 Victoria Metrics Auth - is a simple auth proxy ...
vm/victoria-metrics-cluster 0.8.30 1.62.0 Victoria Metrics Cluster version - high-perform...
vm/victoria-metrics-k8s-stack 0.2.8 1.16.0 Kubernetes monitoring on VictoriaMetrics stack....
vm/victoria-metrics-operator 0.1.15 0.15.1 Victoria Metrics Operator
vm/victoria-metrics-single 0.7.4 1.62.0 Victoria Metrics Single version - high-performa...
```
**2. Install VictoriaMetrics Single from helm Chart**
Run this command in your terminal:
```yaml
cat </targets
Read Data:
The following url can be used as the datasource url in Grafana:
http://victoria-metrics-victoria-metrics-single-server.default.svc.cluster.local:8428
```
For us it’s important to remember the url for the datasource (copy lines from output).
Verify that VictoriaMetrics pod is up and running by executing the following command:
```bash
kubectl get pods
```
The expected output is:
```bash
NAME READY STATUS RESTARTS AGE
victoria-metrics-victoria-metrics-single-server-0 1/1 Running 0 22s
```
**3. Install and connect Grafana to VictoriaMetrics with helm**
Add the Grafana helm repository.
```bash
helm repo add grafana https://grafana.github.io/helm-charts
helm repo update
```
See more info on Grafana ArtifactHUB [https://artifacthub.io/packages/helm/grafana/grafana](https://artifacthub.io/packages/helm/grafana/grafana)
By installing the Chart with the release name `my-grafana`, you add the VictoriaMetrics datasource with official dashboard and kubernetes dashboard:
```yaml
cat <
 You will see something like this:

VictoriaMetrics dashboard also available to use:

**5. Final thoughts**
* We have set up TimeSeries Database for your k8s cluster.
* We collected metrics from all running pods, nodes, … and stored them in VictoriaMetrics database.
* We can visualize the resources used in your Kubernetes cluster by using Grafana dashboards.