|
|
||
|---|---|---|
| .. | ||
| assets | ||
| base | ||
| builder | ||
| provisioning | ||
| victorialogs | ||
| vm-datasource | ||
| vmanomaly | ||
| alertmanager.yml | ||
| alerts-cluster.yml | ||
| alerts-health.yml | ||
| alerts-vmagent.yml | ||
| alerts-vmalert.yml | ||
| alerts-vmauth.yml | ||
| alerts.yml | ||
| auth-cluster.yml | ||
| docker-compose-cluster.yml | ||
| docker-compose-victorialogs.yml | ||
| docker-compose.yml | ||
| fluent-bit.conf | ||
| Makefile | ||
| prometheus-cluster.yml | ||
| prometheus-victorialogs.yml | ||
| prometheus.yml | ||
| README.md | ||
Docker compose environment for VictoriaMetrics
Docker compose environment for VictoriaMetrics includes VictoriaMetrics components, Alertmanager and Grafana.
For starting the docker-compose environment ensure you have docker installed and running and access to the Internet. All commands should be executed from the root directory of the repo.
- VictoriaMetrics single server
- VictoriaMetrics cluster
- vmagent
- vmauth
- vmalert
- alertmanager
- Alerts
- Grafana
- VictoriaLogs
VictoriaMetrics single server
To spin-up environment with VictoriaMetrics single server run the following command:
make docker-single-up
VictoriaMetrics will be accessible on the following ports:
--graphiteListenAddr=:2003--opentsdbListenAddr=:4242--httpListenAddr=:8428
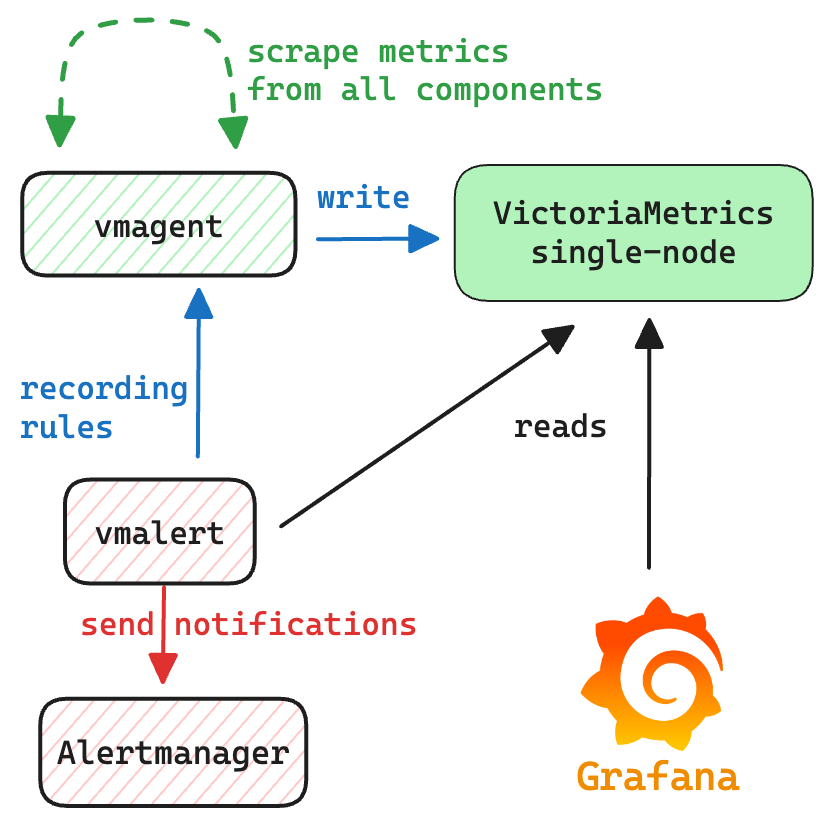
The communication scheme between components is the following:
- vmagent sends scraped metrics to
single server VictoriaMetrics; - grafana is configured with datasource pointing to
single server VictoriaMetrics; - vmalert is configured to query
single server VictoriaMetricsand send alerts state and recording rules back to it; - alertmanager is configured to receive notifications from
vmalert.

To access Grafana use link http://localhost:3000.
To access vmui use link http://localhost:8428/vmui.
To access vmalert use link http://localhost:8428/vmalert.
To shutdown environment execute the following command:
make docker-single-down
VictoriaMetrics cluster
To spin-up environment with VictoriaMetrics cluster run the following command:
make docker-cluster-up
VictoriaMetrics cluster environment consists of vminsert, vmstorage and vmselect components.
vminsert has exposed port :8480, access to vmselect components goes through vmauth on port :8427,
and the rest of components are available only inside the environment.
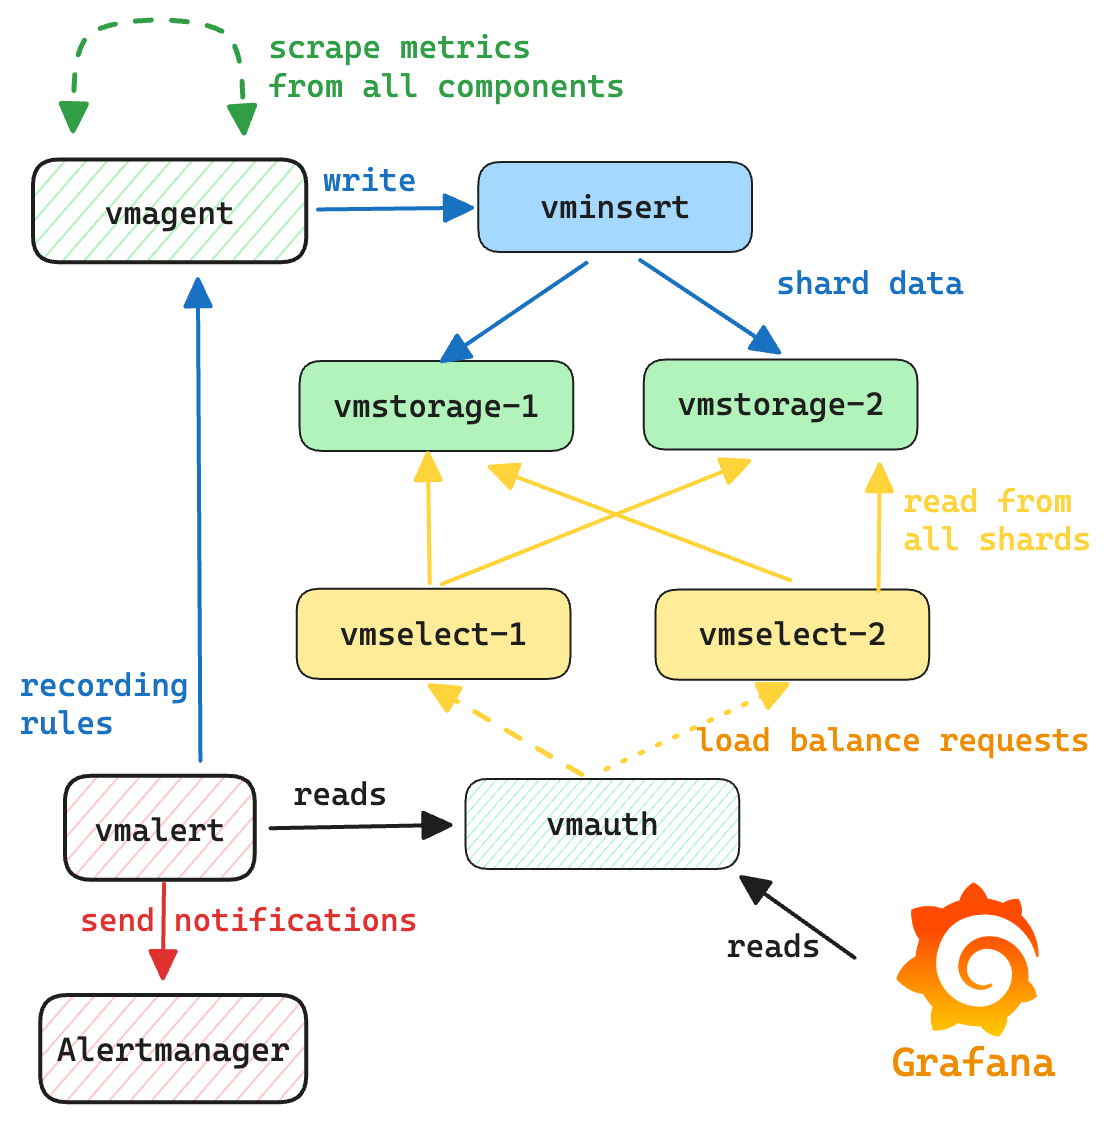
The communication scheme between components is the following:
- vmagent sends scraped metrics to
vminsert; vminsertforwards data tovmstorage;vmselects are connected tovmstoragefor querying data;- vmauth balances incoming read requests among
vmselects; - grafana is configured with datasource pointing to
vmauth; - vmalert is configured to query
vmselects viavmauthand send alerts state and recording rules tovminsert; - alertmanager is configured to receive notifications from
vmalert.

To access Grafana use link http://localhost:3000.
To access vmui use link http://localhost:8427/select/0/prometheus/vmui/.
To access vmalert use link http://localhost:8427/select/0/prometheus/vmalert/.
To shutdown environment execute the following command:
make docker-cluster-down
vmagent
vmagent is used for scraping and pushing time series to VictoriaMetrics instance. It accepts Prometheus-compatible configuration prometheus.yml with listed targets for scraping.
vmauth
vmauth acts as a balancer
to spread the load across vmselect's. Grafana and vmalert use vmauth for read queries.
vmauth config is available here
vmalert
vmalert evaluates alerting rules alerts.yml to track VictoriaMetrics health state. It is connected with AlertManager for firing alerts, and with VictoriaMetrics for executing queries and storing alert's state.
alertmanager
AlertManager accepts notifications from vmalert and fires alerts.
All notifications are blackholed according to alertmanager.yml config.
Grafana
To access service open following link.
Default credential:
- login -
admin - password -
admin
Grafana is provisioned by default with following entities:
VictoriaMetricsdatasourceVictoriaMetrics - clusterdatasourceVictoriaMetrics overviewdashboardVictoriaMetrics - clusterdashboardVictoriaMetrics - vmagentdashboardVictoriaMetrics - vmalertdashboard
Remember to pick VictoriaMetrics - cluster datasource when viewing VictoriaMetrics - cluster dashboard.
Optionally, environment with VictoriaMetrics Grafana datasource can be started with the following commands:
make docker-single-vm-datasource-up    # start single server
make docker-single-vm-datasource-down  # shut down single server

make docker-cluster-vm-datasource-up   # start cluster
make docker-cluster-vm-datasource-down # shutdown cluster
Alerts
See below a list of recommended alerting rules for various VictoriaMetrics components for running in production. Some alerting rules thresholds are just recommendations and could require an adjustment. The list of alerting rules is the following:
- alerts-health.yml: alerting rules related to all VictoriaMetrics components for tracking their "health" state;
- alerts.yml: alerting rules related to single-server VictoriaMetrics installation;
- alerts-cluster.yml: alerting rules related to cluster version of VictoriaMetrics;
- alerts-vmagent.yml: alerting rules related to vmagent component;
- alerts-vmalert.yml: alerting rules related to vmalert component;
- alerts-vmauth.yml: alerting rules related to vmauth component;
Please, also see how to monitor VictoriaMetrics installations.
VictoriaLogs server
To spin-up environment with VictoriaLogs run the following command:
make docker-victorialogs-up
VictoriaLogs will be accessible on the --httpListenAddr=:9428 port.
In addition to VictoriaLogs server, the docker compose contains the following componetns:
- fluentbit service for collecting docker logs and sending them to VictoriaLogs;
- VictoriaMetrics single server to collect metrics from
VictoriaLogsandfluentbit; - grafana is configured with VictoriaLogs datasource.
To access Grafana use link http://localhost:3000.
To access VictoriaLogs UI use link http://localhost:9428/select/vmui.
Please, also see how to monitor VictoriaLogs installations.
To shutdown environment execute the following command:
make docker-victorialogs-down
Please see more examples on integration of VictoriaLogs with other log shippers below: