### Describe Your Changes Please provide a brief description of the changes you made. Be as specific as possible to help others understand the purpose and impact of your modifications. ### Checklist The following checks are **mandatory**: - [ ] My change adheres [VictoriaMetrics contributing guidelines](https://docs.victoriametrics.com/contributing/). |
||
|---|---|---|
| .. | ||
| _index.md | ||
| autotune.webp | ||
| model-lifecycle-multivariate.webp | ||
| model-lifecycle-univariate.webp | ||
| model-type-non-rolling.webp | ||
| model-type-rolling.webp | ||
| models.md | ||
| monitoring.md | ||
| reader.md | ||
| README.md | ||
| scheduler.md | ||
| schema_detection_direction=above_expected.webp | ||
| schema_detection_direction=below_expected.webp | ||
| schema_detection_direction=both.webp | ||
| schema_min_dev_from_expected=0.webp | ||
| schema_min_dev_from_expected=1.0.webp | ||
| schema_min_dev_from_expected=5.0.webp | ||
| vmanomaly-components.webp | ||
| writer.md | ||
This chapter describes different components, that correspond to respective sections of a config to launch VictoriaMetrics Anomaly Detection (or simply vmanomaly) service:
- Model(s) section - Required
- Reader section - Required
- Scheduler(s) section - Required
- Writer section - Required
- Monitoring section - Optional
Note
: starting from v1.7.0, once the service starts, automated config validation is performed. Please see container logs for errors that need to be fixed to create fully valid config, visiting sections above for examples and documentation.
Note
: starting from v1.13.0, components' class can be referenced by a short alias instead of a full class path - i.e.
model.zscore.ZscoreModelbecomeszscore,reader.vm.VmReaderbecomesvm,scheduler.periodic.PeriodicSchedulerbecomesperiodic, etc. Please see according sections for the details.
Note: Starting from v1.13.0
presetmodes are available forvmanomaly. Please find the guide here.
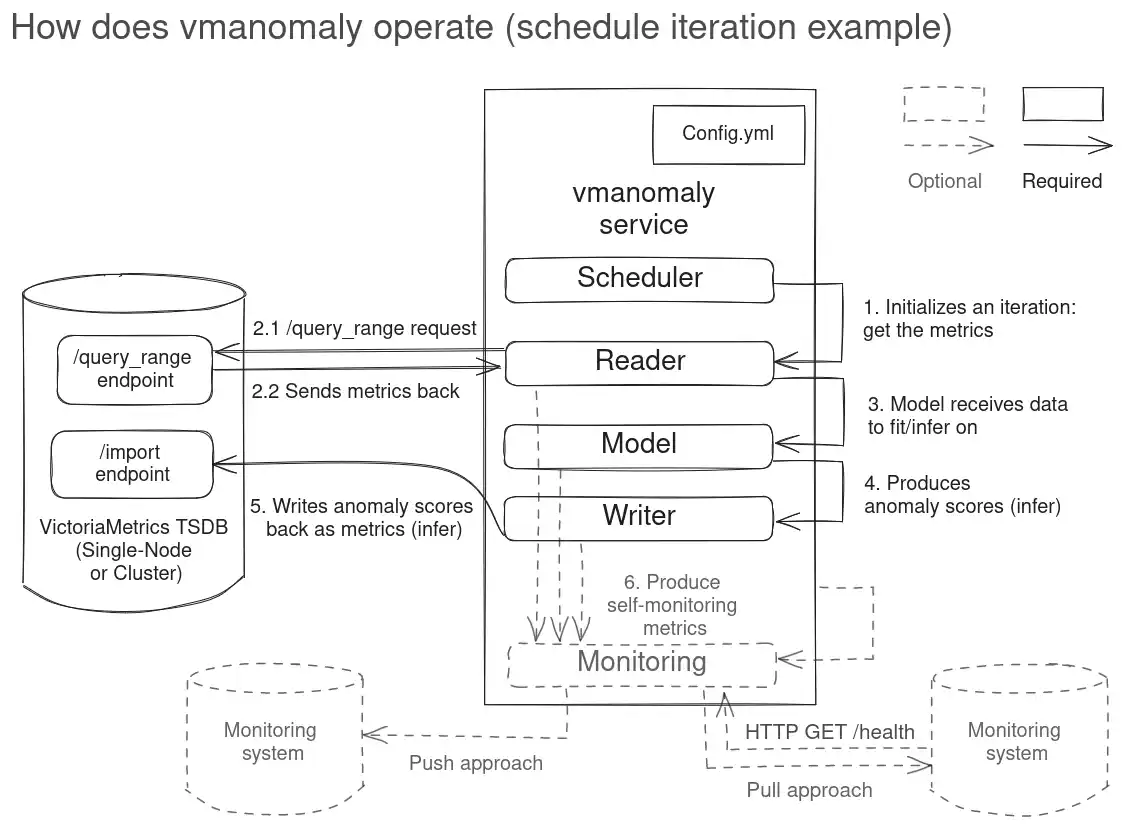
Below, you will find an example illustrating how the components of vmanomaly interact with each other and with a single-node VictoriaMetrics setup.
Note
: Reader and Writer also support multitenancy, so you can read/write from/to different locations - see
tenant_idparam description.

Here's a minimalistic full config example, demonstrating many-to-many configuration (actual for latest version):
# how and when to run the models is defined by schedulers
# https://docs.victoriametrics.com/anomaly-detection/components/scheduler/
schedulers:
  periodic_1d:  # alias
    class: 'periodic' # scheduler class
    infer_every: "30s"
    fit_every: "10m"
    fit_window: "24h"
  periodic_1w:
    class: 'periodic'
    infer_every: "15m"
    fit_every: "1h"
    fit_window: "7d"

# what model types and with what hyperparams to run on your data
# https://docs.victoriametrics.com/anomaly-detection/components/models/
models:
  zscore:  # alias
    class: 'zscore'  # model class
    z_threshold: 3.5
    provide_series: ['anomaly_score']  # what series to produce
    queries: ['host_network_receive_errors']  # what queries to run particular model on
    schedulers: ['periodic_1d']  # will be attached to 1-day schedule, fit every 10m and infer every 30s
  prophet: # alias
    class: 'prophet'
    provide_series: ['anomaly_score', 'yhat', 'yhat_lower', 'yhat_upper']
    queries: ['cpu_seconds_total']
    schedulers: ['periodic_1w']  # will be attached to 1-week schedule, fit every 1h and infer every 15m
    args:  # model-specific arguments
      interval_width: 0.98

# where to read data from
# https://docs.victoriametrics.com/anomaly-detection/components/reader/
reader:
  datasource_url: "http://victoriametrics:8428/"
  tenant_id: "0:0"
  class: 'vm'
  sampling_period: "30s"  # what data resolution of your data to have
  queries:  # aliases to MetricsQL expressions
    cpu_seconds_total: 'avg(rate(node_cpu_seconds_total[5m])) by (mode)'
    host_network_receive_errors: 'rate(node_network_receive_errs_total[3m]) / rate(node_network_receive_packets_total[3m])'

# where to write data to
# https://docs.victoriametrics.com/anomaly-detection/components/writer/
writer:
  datasource_url: "http://victoriametrics:8428/"

# enable self-monitoring in pull and/or push mode
# https://docs.victoriametrics.com/anomaly-detection/components/monitoring/
monitoring:
  pull: # Enable /metrics endpoint.
    addr: "0.0.0.0"
    port: 8490