mirror of
https://github.com/VictoriaMetrics/VictoriaMetrics.git
synced 2025-01-10 15:14:09 +00:00
* [vmalert] config parser * make linter be happy * fix test * fix sprintf add test for rule validation |
||
|---|---|---|
| .. | ||
| common | ||
| config | ||
| datasource | ||
| provider | ||
| storage | ||
| main.go | ||
| README.md | ||
| vmalert.png | ||
VM Alert
Abstract
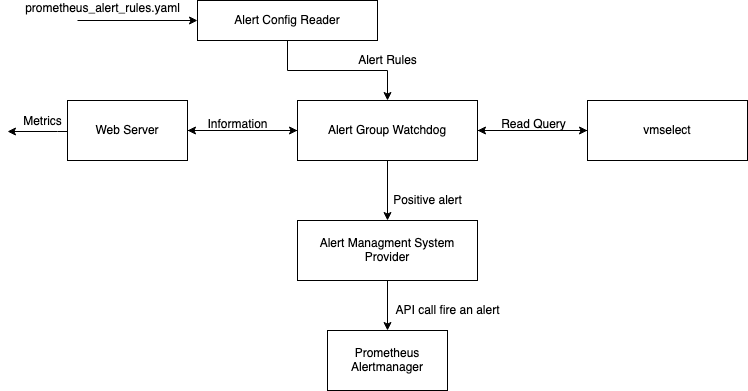
The application which accepts the alert rules, executes them on given source, sends(fires) an alert to(in) alert management system
Components
Alert Config Reader
It accepts yaml config as input parameter in Prometheus format, parses it into Go struct.
Source Caller
Create own watchdog for every alert group (goroutines), which executes alert query on given source and issues an alert if source returns non-empty result. Source can be any service which supports PromQL (MetricsQL).
Alert Management System Provider
Send positive alert to alert management system, provides interface for every concrete implementation. Should be ingratiated with Prometheus alertmanager.
open questions:
- do we really need alert group or can just run every alert in own goroutine?
Web Server
Expose metrics
open questions:
- should the tool provide API or UI for managing alerting rules? Where to store config updated via the API or UI?
- should the tool provide “alerting rules validation mode” for validating and debugging alerting rules? This mode is useful when creating and debugging alerting rules.
Requirements:
- Stateless
- Avoid external dependencies if possible
- Reuse existing code from VictoriaMetrics repo
- Makefile rules for common tasks – see Makefiles for other apps in the app/ dir
- Every package should be covered by tests
- Dockerfile
- Graceful shutdown
- Helm template
- Application uses command line flags for configuration
