Previously Block columns wasn't properly limited by maxColumnsPerBlock.
And it was possible a case, when more columns per block added than
expected.
 For example, if ingested log stream has many unuqie fields
and it's sum exceed maxColumnsPerBlock.
 We only enforce fieldsPerBlock limit during row parsing, which limits
isn't enough to mitigate this issue. Also it
would be very expensive to apply maxColumnsPerBlock limit during
ingestion, since it requires to track all possible field tags
combinations.

 This commit adds check for maxColumnsPerBlock limit during
MustInitFromRows function call. And it returns offset of the rows and
timestamps added to the block.
 Function caller must create another block and ingest remaining rows
into it.

Related issue:
https://github.com/VictoriaMetrics/VictoriaMetrics/issues/7568

### Describe Your Changes

Please provide a brief description of the changes you made. Be as
specific as possible to help others understand the purpose and impact of
your modifications.

### Checklist

The following checks are **mandatory**:

- [ ] My change adheres [VictoriaMetrics contributing
guidelines](https://docs.victoriametrics.com/contributing/).

---------

Signed-off-by: f41gh7 <nik@victoriametrics.com>
Co-authored-by: Aliaksandr Valialkin <valyala@victoriametrics.com>
This metric tracks an approximate amounts of bytes processed when parsing the ingested logs.
The metric is exposed individually per every supported data ingestion protocol. The protocol name
is exposed via "type" label in order to be consistent with vl_rows_ingested_total metric.

Thanks to @tenmozes for the initial idea and implementation at https://github.com/VictoriaMetrics/VictoriaMetrics/pull/7682

While at it, remove the unneeded "format" label from vl_rows_ingested_total metric.
The "type" label must be enough for encoding the data ingestion format.
### Describe Your Changes

- Fixes the handling of the `showLegend` flag.
- Fixes the handling of `alias`.
- Adds support for alias templates, allowing dynamic substitutions like
`{{label_name}}`.

Related issue:
https://github.com/VictoriaMetrics/VictoriaMetrics/issues/7565
### Describe Your Changes

- **Memory Optimization**: Reduced memory consumption on the "Group" and
"JSON" tabs by approximately 30%.

- **Table Pagination**: Added pagination to the "Table" view with an
option to select the number of rows displayed (from 10 to 1000 items per
page, with a default of 1000). This change significantly reduced memory
usage by approximately 75%.

Related to #7185

### Checklist

The following checks are **mandatory**:

- [ ] My change adheres [VictoriaMetrics contributing
guidelines](https://docs.victoriametrics.com/contributing/).

---------

Co-authored-by: Roman Khavronenko <roman@victoriametrics.com>
By default the delay equals to 1 second.

While at it, document refresh_interval query arg at /select/logsql/tail endpoint.

Thanks to @Fusl for the idea and the initial implementation at https://github.com/VictoriaMetrics/VictoriaMetrics/pull/7428

(cherry picked from commit a44787372f)
### Describe Your Changes

add sorting of logs by groups and within each group by time in desc
order. See #7184 and #7045

### Checklist

The following checks are **mandatory**:

- [ ] My change adheres [VictoriaMetrics contributing
guidelines](https://docs.victoriametrics.com/contributing/).

Co-authored-by: Aliaksandr Valialkin <valyala@victoriametrics.com>
(cherry picked from commit 1e1952acf5)
Loki protocol supports optional `metadata` object for each ingested line. It's added as 3rd field at the (ts,msg,metadata) tuple. Previously,  loki request json parsers rejected log line if tuple size != 2.

This commit allows optional tuple field. It parses it as json object and adds it as log metadata fields to the  log message stream.

related issue:
https://github.com/VictoriaMetrics/VictoriaMetrics/issues/7431

---------
Co-authored-by: f41gh7 <nik@victoriametrics.com>

(cherry picked from commit 3aeb1b96a2)
### Describe Your Changes

Christmas is early and you get the first present in the shape of
spelling fixes.
Sorry for the big amount :)

### Checklist

- [x] My change adheres [VictoriaMetrics contributing
guidelines](https://docs.victoriametrics.com/contributing/).

(cherry picked from commit 2e8f420d84)
In this case the _msg field is set to the value specified in the -defaultMsgValue command-line flag.

This should simplify first-time migration to VictoriaLogs from other systems.

(cherry picked from commit 16ee470da6)
This msy be useful when ingesting logs from different sources, which store the log message in different fields.
For example, `_msg_field=message,event.data,some_field` will get log message from the first non-empty field:
`message`, `event.data` and `some_field`.

(cherry picked from commit ed73f8350b)
If the number of output (bloom, values) shards is zero, then this may lead to panic
as shown at https://github.com/VictoriaMetrics/VictoriaMetrics/issues/7391 .

This panic may happen when parts with only constant fields with distinct values are merged into
output part with non-constant fields, which should be written to (bloom, values) shards.

(cherry picked from commit 102e9d4f4e)
This allows reducing the amounts of data, which must be read during queries over logs with big number of fields (aka "wide events").
This, in turn, improves query performance when the data, which needs to be scanned during the query, doesn't fit OS page cache.

(cherry picked from commit 7a62eefa34)
This improves performance of `field_values` pipe when it is applied to large number of data blocks.
This also improves performance of /select/logsql/field_values HTTP API.

(cherry picked from commit 8d968acd0a)
### Describe Your Changes

Fixes issues with incorrect updating of query and limit fields, and
resolves the problem where the display tab resets.

Related issue: #7279 and #7290

### Checklist

The following checks are **mandatory**:

- [ ] My change adheres [VictoriaMetrics contributing
guidelines](https://docs.victoriametrics.com/contributing/).

---------

Signed-off-by: hagen1778 <roman@victoriametrics.com>
Co-authored-by: Zakhar Bessarab <z.bessarab@victoriametrics.com>
### Describe Your Changes
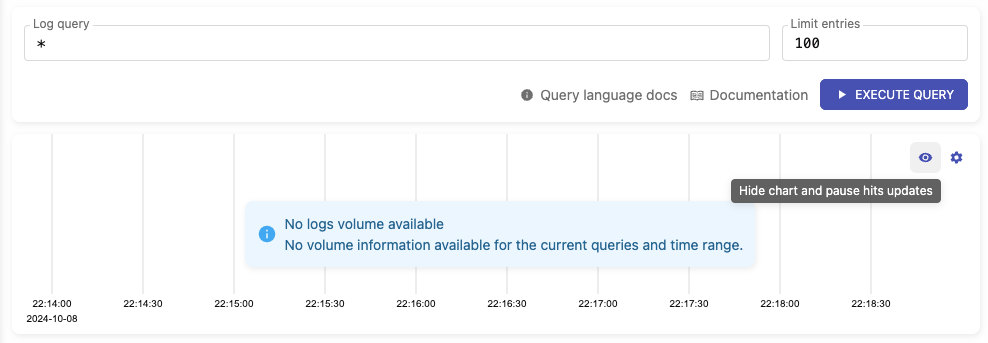
**Added ability to hide the hits chart**
- Users can now hide or show the hits chart by clicking the "eye" icon
located in the upper-right corner of the chart.
- When the chart is hidden, it will stop sending requests to
`/select/logsql/hits`.
- Upon displaying the chart again, it will automatically refresh. If a
relative time range is set, the chart will update according to the time
period of the logs currently being displayed.
**Hits chart visible:**

**Hits chart hidden:**

Related issue: #7117
### Checklist
The following checks are **mandatory**:
- [ ] My change adheres [VictoriaMetrics contributing
guidelines](https://docs.victoriametrics.com/contributing/).
Co-authored-by: Aliaksandr Valialkin <valyala@victoriametrics.com>
(cherry picked from commit 423df09d7d)
### Describe Your Changes

Fixed the display of hits chart in VictoriaLogs.
See #7133

### Checklist

The following checks are **mandatory**:

- [ ] My change adheres [VictoriaMetrics contributing
guidelines](https://docs.victoriametrics.com/contributing/).

(cherry picked from commit 36a86c3aaf)