Each Grafana dashboard has unique ID which can be used to fetch the dashboard
from grafana.com: https://grafana.com/grafana/dashboards/11176
The same dashboard can be accessed via URL with slug: https://grafana.com/grafana/dashboards/11176-victoriametrics-cluster/
But using slug implies that any change to dashboard name will break the link.
So it is better to just use ID, so the dashboard URL will never break.

This is follow-up for ff33e60a3d

Signed-off-by: hagen1778 <roman@victoriametrics.com>
2.3 KiB
| sort | weight | title | menu | aliases | |||||||
|---|---|---|---|---|---|---|---|---|---|---|---|
| 6 | 6 | Monitoring |
|
|
Monitoring of VictoriaMetrics Operator
VictoriaMetrics operator exports internal metrics in Prometheus exposition format at /metrics page.
These metrics can be scraped via vmagent or Prometheus.
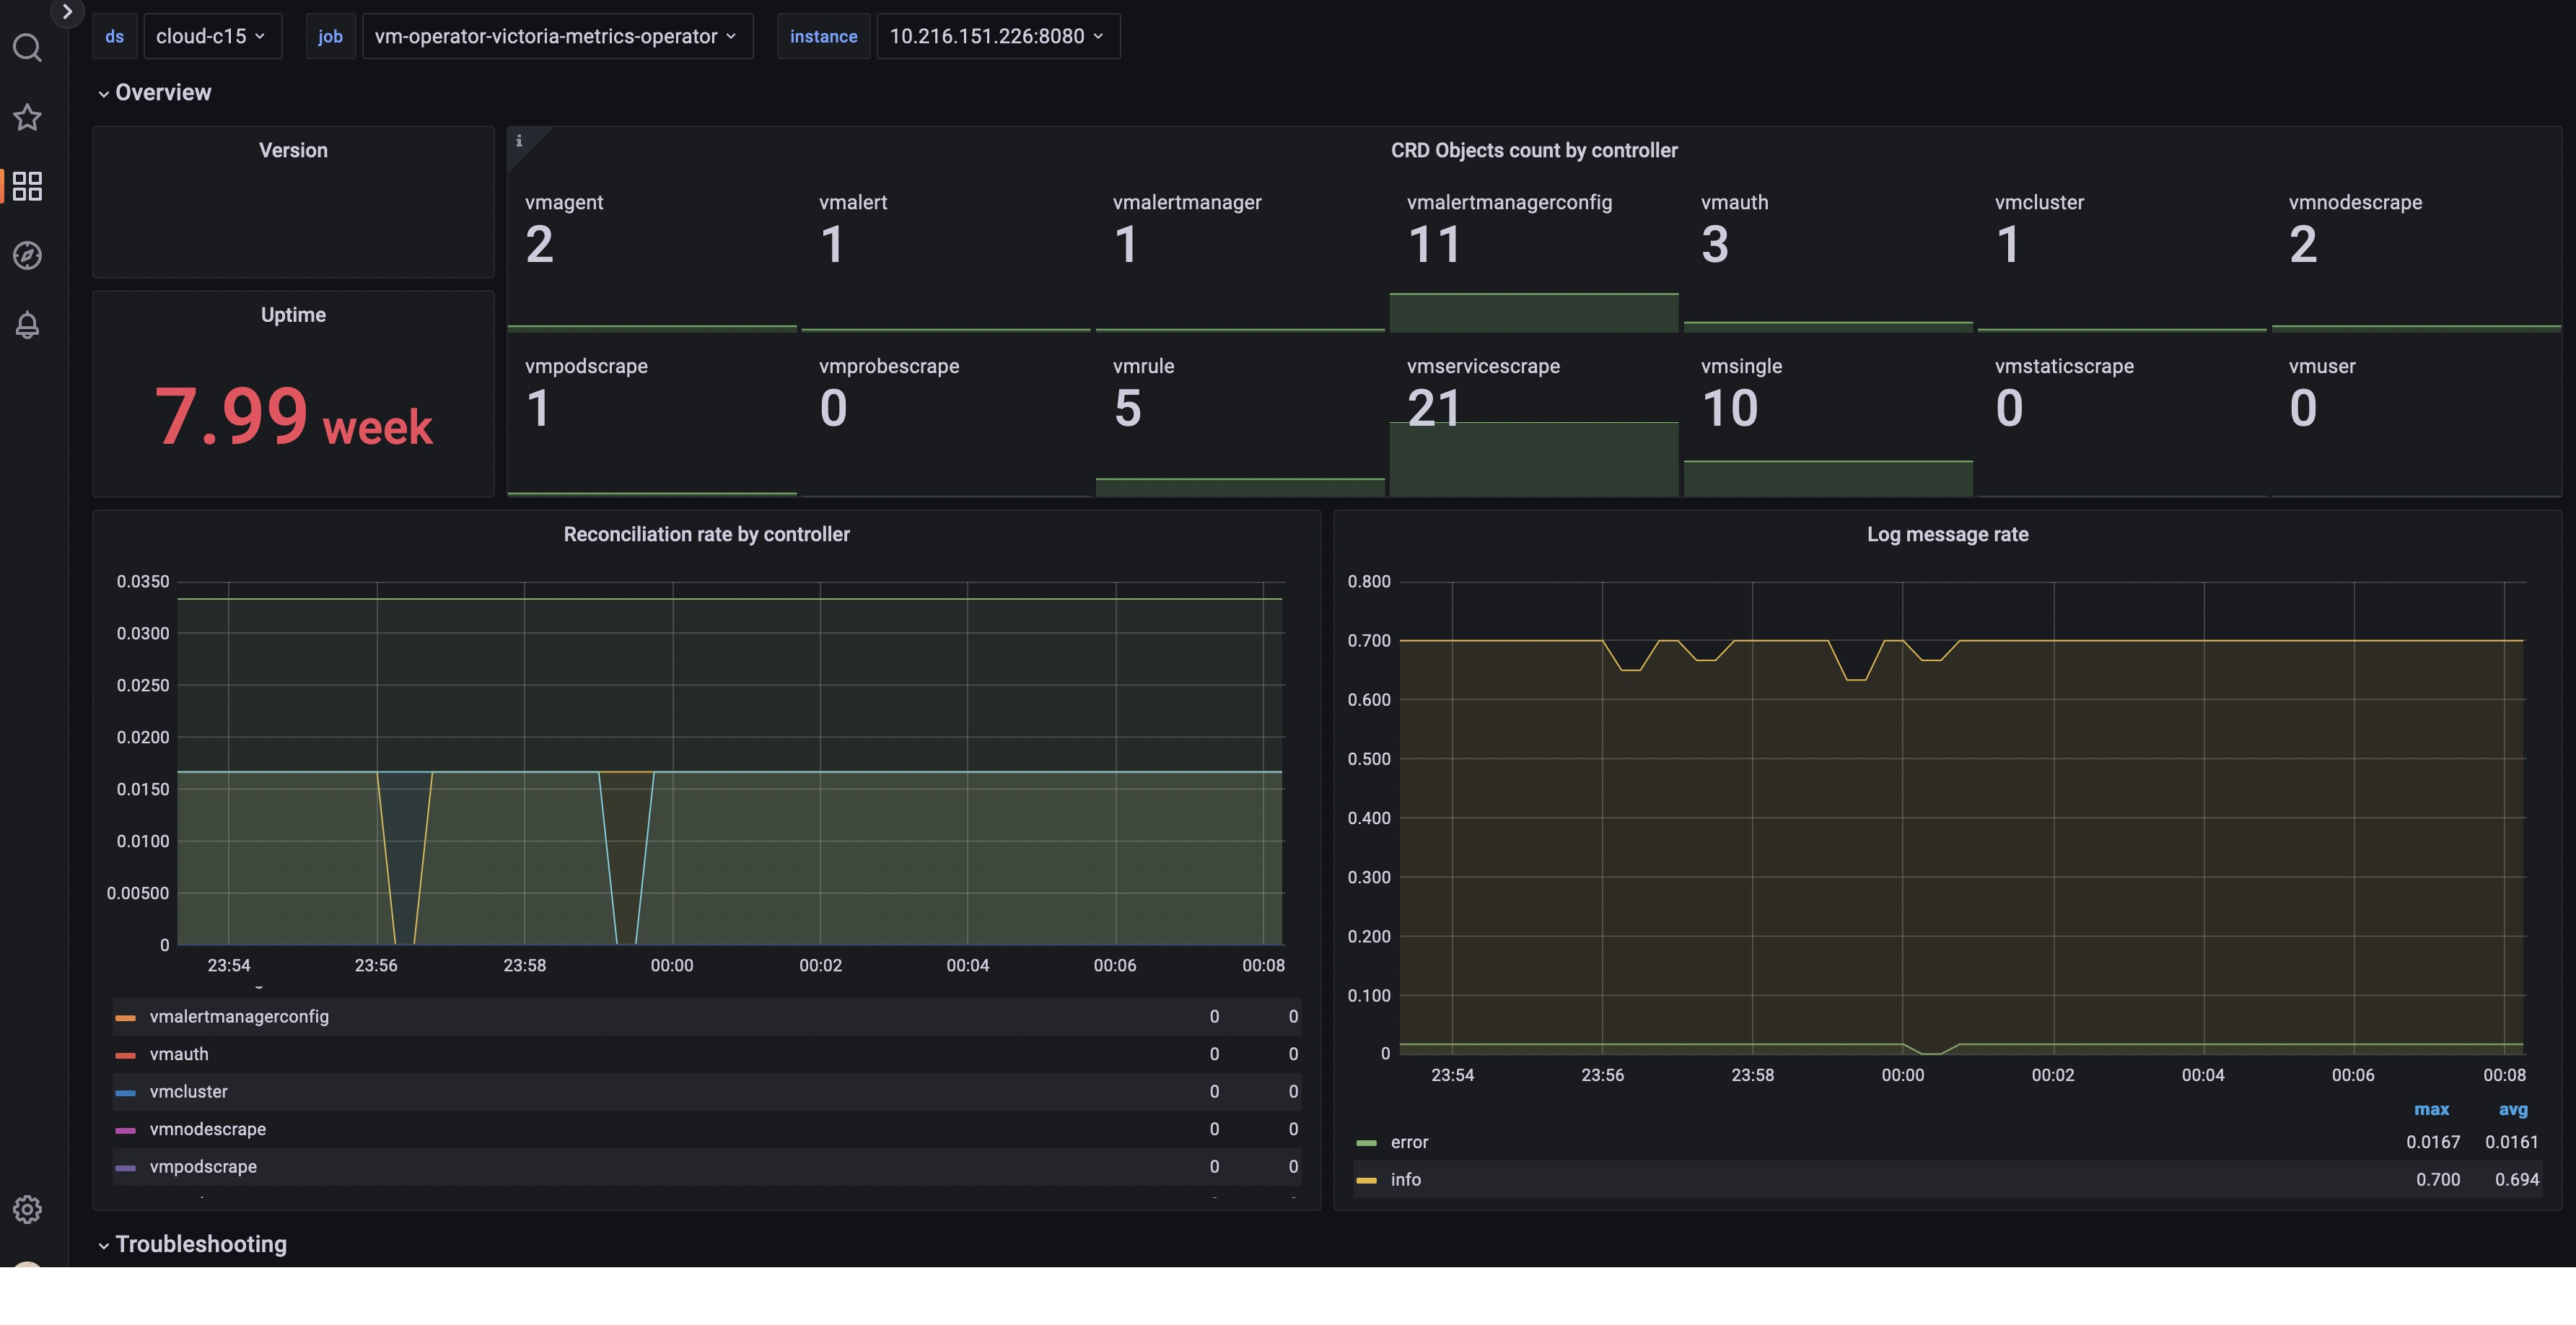
Dashboard
Official Grafana dashboard available for vmoperator.

Graphs on the dashboards contain useful hints - hover the i icon in the top left corner of each graph to read it.
Configuration
Helm-chart victoria-metrics-k8s-stack
In victoria-metrics-k8s-stack helm-chart operator self-scrapes metrics by default.
This helm-chart also includes official grafana dashboard for operator.
Helm-chart victoria-metrics-operator
With victoria-metrics-operator you can use following parameter in values.yaml:
# values.yaml
#...
# -- configures monitoring with serviceScrape. VMServiceScrape must be pre-installed
serviceMonitor:
  enabled: true
This parameter makes helm-chart to create a scrape-object for installed operator instance.
You will also need to deploy a (vmsingle)[./resources/vmsingle.md] where the metrics will be collected.
Pure operator installation
With pure operator installation you can use config with separate vmsingle and scrape object for operator like that:
apiVersion: operator.victoriametrics.com/v1beta1
kind: VMServiceScrape
metadata:
  name: vmoperator
  namespace: monitoring
spec:
  selector:
    matchLabels:
      app.kubernetes.io/instance: vm-operator
      app.kubernetes.io/name: victoria-metrics-operator
  endpoints:
    - port: http
  namespaceSelector:
    matchNames:
      - monitoring
See more info about object VMServiceScrape.
You will also need a vmsingle where the metrics will be collected.