docs: update links to grafana dashboards

Signed-off-by: Artem Navoiev <tenmozes@gmail.com>
12 KiB
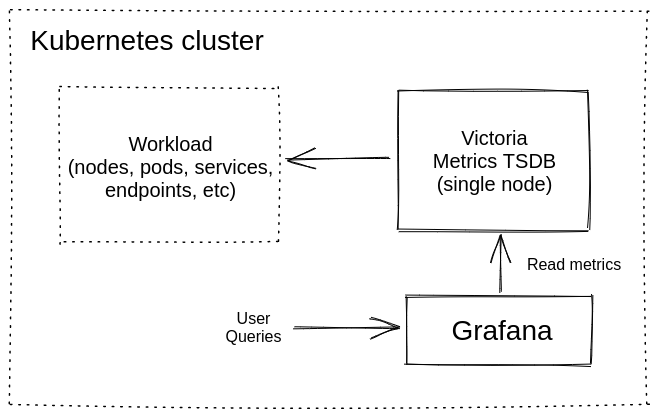
Kubernetes monitoring via VictoriaMetrics Single
This guide covers:
- The setup of a VictoriaMetrics Single in Kubernetes via Helm charts
- How to scrape metrics from k8s components using service discovery
- How to visualize stored data
- How to store metrics in VictoriaMetrics tsdb
Precondition
We will use:
We use GKE cluster from GCP but this guide is also applied on any Kubernetes cluster. For example Amazon EKS.

1. VictoriaMetrics Helm repository
For this guide we will use Helm 3 but if you already use Helm 2 please see this https://github.com/VictoriaMetrics/helm-charts#for-helm-v2
You need to add the VictoriaMetrics Helm repository to install VictoriaMetrics components. We’re going to use VictoriaMetrics Single. You can do this by running the following command:
helm repo add vm https://victoriametrics.github.io/helm-charts/
Update Helm repositories:
helm repo update
To verify that everything is set up correctly you may run this command:
helm search repo vm/
The expected output is:
NAME                         	CHART VERSION	APP VERSION	DESCRIPTION
vm/victoria-metrics-agent    	0.7.20       	v1.62.0    	Victoria Metrics Agent - collects metrics from ...
vm/victoria-metrics-alert    	0.3.34       	v1.62.0    	Victoria Metrics Alert - executes a list of giv...
vm/victoria-metrics-auth     	0.2.23       	1.62.0     	Victoria Metrics Auth - is a simple auth proxy ...
vm/victoria-metrics-cluster  	0.8.32       	1.62.0     	Victoria Metrics Cluster version - high-perform...
vm/victoria-metrics-k8s-stack	0.2.9        	1.16.0     	Kubernetes monitoring on VictoriaMetrics stack....
vm/victoria-metrics-operator 	0.1.17       	0.16.0     	Victoria Metrics Operator
vm/victoria-metrics-single   	0.7.5        	1.62.0     	Victoria Metrics Single version - high-performa...
2. Install VictoriaMetrics Single from Helm Chart
Run this command in your terminal:
helm install vmsingle vm/victoria-metrics-single -f https://docs.victoriametrics.com/guides/guide-vmsingle-values.yaml
Here is full file content guide-vmsingle-values.yaml
server:
  scrape:
    enabled: true
    configMap: ""
    config:
      global:
        scrape_interval: 15s
      scrape_configs:
        - job_name: victoriametrics
          static_configs:
            - targets: [ "localhost:8428" ]
        - job_name: "kubernetes-apiservers"
          kubernetes_sd_configs:
            - role: endpoints
          scheme: https
          tls_config:
            ca_file: /var/run/secrets/kubernetes.io/serviceaccount/ca.crt
            insecure_skip_verify: true
          bearer_token_file: /var/run/secrets/kubernetes.io/serviceaccount/token
          relabel_configs:
            - source_labels:
                [
                    __meta_kubernetes_namespace,
                    __meta_kubernetes_service_name,
                    __meta_kubernetes_endpoint_port_name,
                ]
              action: keep
              regex: default;kubernetes;https
        - job_name: "kubernetes-nodes"
          scheme: https
          tls_config:
            ca_file: /var/run/secrets/kubernetes.io/serviceaccount/ca.crt
            insecure_skip_verify: true
          bearer_token_file: /var/run/secrets/kubernetes.io/serviceaccount/token
          kubernetes_sd_configs:
            - role: node
          relabel_configs:
            - action: labelmap
              regex: __meta_kubernetes_node_label_(.+)
            - target_label: __address__
              replacement: kubernetes.default.svc:443
            - source_labels: [ __meta_kubernetes_node_name ]
              regex: (.+)
              target_label: __metrics_path__
              replacement: /api/v1/nodes/$1/proxy/metrics
        - job_name: "kubernetes-nodes-cadvisor"
          scheme: https
          tls_config:
            ca_file: /var/run/secrets/kubernetes.io/serviceaccount/ca.crt
            insecure_skip_verify: true
          bearer_token_file: /var/run/secrets/kubernetes.io/serviceaccount/token
          kubernetes_sd_configs:
            - role: node
          relabel_configs:
            - action: labelmap
              regex: __meta_kubernetes_node_label_(.+)
            - target_label: __address__
              replacement: kubernetes.default.svc:443
            - source_labels: [ __meta_kubernetes_node_name ]
              regex: (.+)
              target_label: __metrics_path__
              replacement: /api/v1/nodes/$1/proxy/metrics/cadvisor
          metric_relabel_configs:
            - action: replace
              source_labels: [pod]
              regex: '(.+)'
              target_label: pod_name
              replacement: '${1}'
            - action: replace
              source_labels: [container]
              regex: '(.+)'
              target_label: container_name
              replacement: '${1}'
            - action: replace
              target_label: name
              replacement: k8s_stub
            - action: replace
              source_labels: [id]
              regex: '^/system\.slice/(.+)\.service$'
              target_label: systemd_service_name
              replacement: '${1}'
- By running
helm install vmsingle vm/victoria-metrics-singlewe install VictoriaMetrics Single to default namespace inside your cluster - By adding
scrape: enable: truewe add and enable autodiscovery scraping from kubernetes cluster to VictoriaMetrics Single - On line 166 from https://docs.victoriametrics.com/guides/guide-vmsingle-values.yaml we added
metric_relabel_configssection that will help us to show Kubernetes metrics on Grafana dashboard.
As a result of the command you will see the following output:
NAME: victoria-metrics
LAST DEPLOYED: Fri Jun 25 12:06:13 2021
NAMESPACE: default
STATUS: deployed
REVISION: 1
TEST SUITE: None
NOTES:
The VictoriaMetrics write api can be accessed via port 8428 on the following DNS name from within your cluster:
    vmsingle-victoria-metrics-single-server.default.svc.cluster.local


Metrics Ingestion:
  Get the Victoria Metrics service URL by running these commands in the same shell:
    export POD_NAME=$(kubectl get pods --namespace default -l "app=server" -o jsonpath="{.items[0].metadata.name}")
    kubectl --namespace default port-forward $POD_NAME 8428

  Write url inside the kubernetes cluster:
    http://vmsingle-victoria-metrics-single-server.default.svc.cluster.local:8428/api/v1/write

Metrics Scrape:
  Pull-based scrapes are enabled
  Scrape config can be displayed by running this command::
    kubectl get cm vmsingle-victoria-metrics-single-server-scrapeconfig -n default

  The target’s information is accessible via api:
    Inside cluster:
      http://vmsingle-victoria-metrics-single-server.default.svc.cluster.local:8428/targets
    Outside cluster:
      You need to port-forward service (see instructions above) and call
      http://<service-host-port>/targets

Read Data:
  The following url can be used as the datasource url in Grafana::
    http://vmsingle-victoria-metrics-single-server.default.svc.cluster.local:8428
For us it’s important to remember the url for the datasource (copy lines from output).
Verify that VictoriaMetrics pod is up and running by executing the following command:
kubectl get pods
The expected output is:
NAME                                                READY   STATUS    RESTARTS   AGE
vmsingle-victoria-metrics-single-server-0   1/1     Running   0          68s
3. Install and connect Grafana to VictoriaMetrics with Helm
Add the Grafana Helm repository.
helm repo add grafana https://grafana.github.io/helm-charts
helm repo update
By installing the Chart with the release name my-grafana, you add the VictoriaMetrics datasource with official dashboard and kubernetes dashboard:
cat <<EOF | helm install my-grafana grafana/grafana -f -
  datasources:
    datasources.yaml:
      apiVersion: 1
      datasources:
        - name: victoriametrics
          type: prometheus
          orgId: 1
          url: http://vmsingle-victoria-metrics-single-server.default.svc.cluster.local:8428
          access: proxy
          isDefault: true
          updateIntervalSeconds: 10
          editable: true

  dashboardProviders:
   dashboardproviders.yaml:
     apiVersion: 1
     providers:
     - name: 'default'
       orgId: 1
       folder: ''
       type: file
       disableDeletion: true
       editable: true
       options:
         path: /var/lib/grafana/dashboards/default

  dashboards:
    default:
      victoriametrics:
        gnetId: 10229
        revision: 22
        datasource: victoriametrics
      kubernetes:
        gnetId: 14205
        revision: 1
        datasource: victoriametrics
EOF
By running this command we:
- Install Grafana from Helm repository.
- Provision VictoriaMetrics datasource with the url from the output above which we copied before.
- Add this https://grafana.com/grafana/dashboards/10229-victoriametrics/ dashboard for VictoriaMetrics.
- Add this https://grafana.com/grafana/dashboards/14205-kubernetes-cluster-monitoring-via-prometheus/ dashboard to see Kubernetes cluster metrics.
Check the output log in your terminal.
To see the password for Grafana admin user use the following command:
kubectl get secret --namespace default my-grafana -o jsonpath="{.data.admin-password}" | base64 --decode ; echo
Expose Grafana service on 127.0.0.1:3000:
export POD_NAME=$(kubectl get pods --namespace default -l "app.kubernetes.io/name=grafana,app.kubernetes.io/instance=my-grafana" -o jsonpath="{.items[0].metadata.name}")

kubectl --namespace default port-forward $POD_NAME 3000
Now Grafana should be accessible on the http://127.0.0.1:3000 address.
4. Check the obtained result in your browser
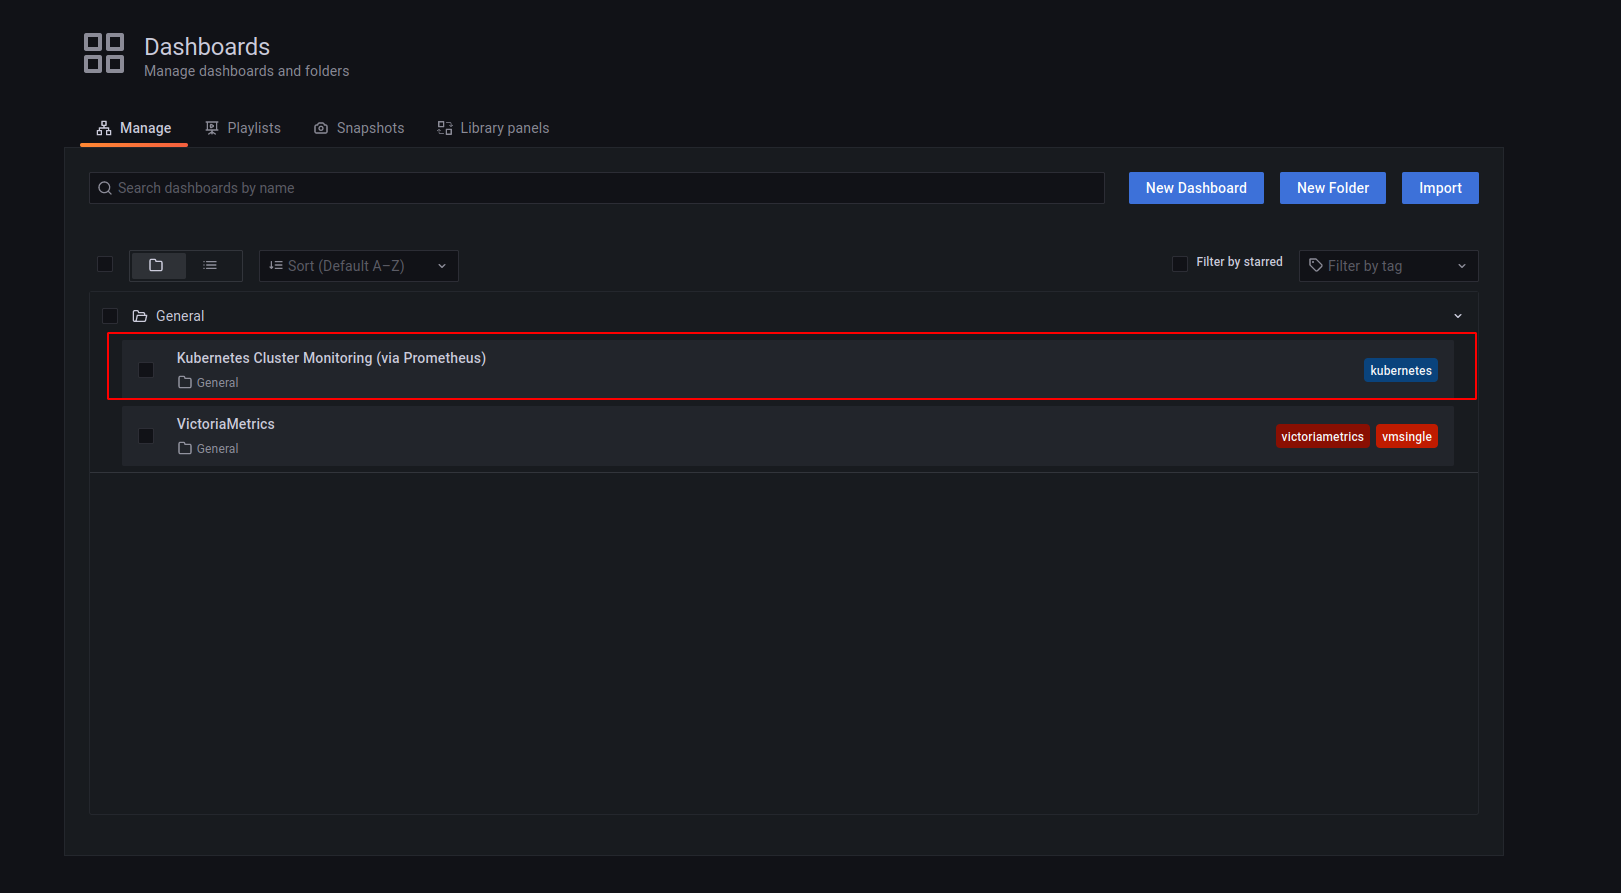
To check that VictoriaMetrics has collects metrics from the k8s cluster open in browser http://127.0.0.1:3000/dashboards and choose Kubernetes Cluster Monitoring (via Prometheus) dashboard. Use admin for login and password that you previously obtained from kubectl.

You will see something like this:

VictoriaMetrics dashboard also available to use:

5. Final thoughts
- We have set up TimeSeries Database for your k8s cluster.
- Collected metrics from all running pods,nodes, … and store them in VictoriaMetrics database.
- Visualize resources used in Kubernetes cluster by Grafana dashboards.