* [draft] per tenant statistic

* updates metric name
update graph
adds link and example config

* quick fix

* adds grafana dashboard
adds example alert

Co-authored-by: f41gh7 <nik@victoriametrics.com>
2.5 KiB
Victoria Metrics Cluster Per Tenant Statistic
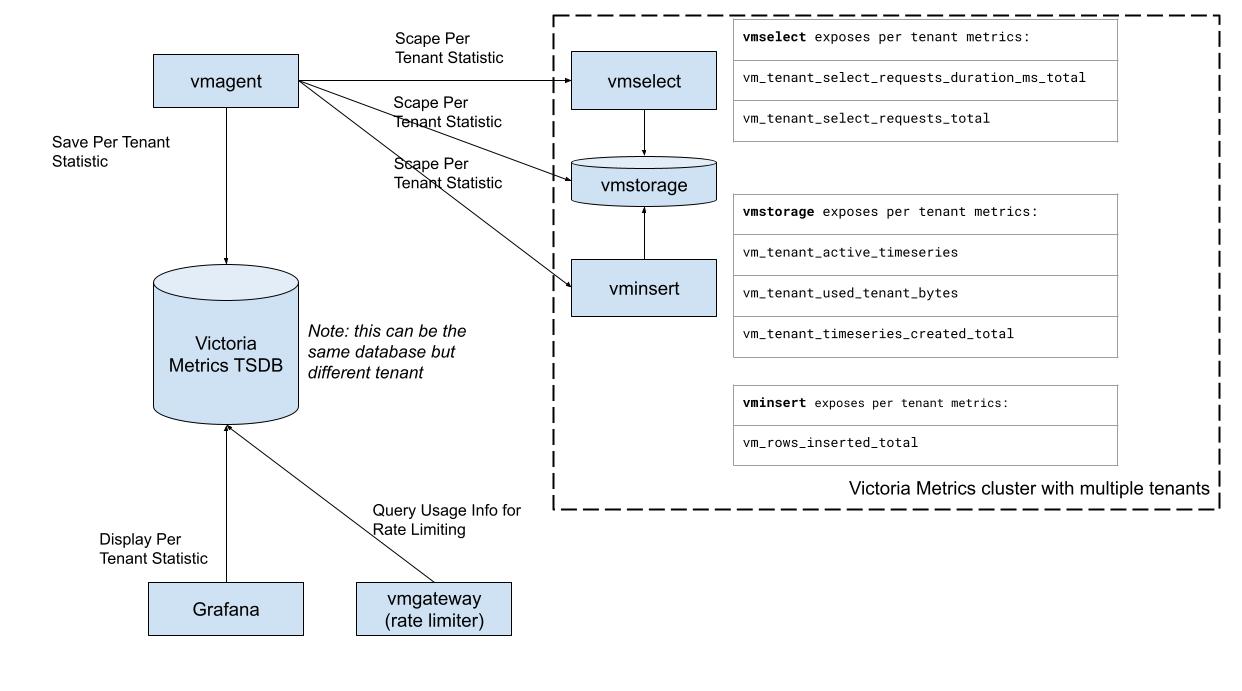
Enterprise version of Victoria Metrics Cluster exposes usage statistic for each tenant.
The next statistic is exposed:
-
vminsertvm_tenant_inserted_rows_total- the ingestion rate by tenant
-
vmselectvm_tenant_select_requests_duration_ms_total- query latency by tenant. It can be usefull for identifing tenant with the most heaviest queriesvm_tenant_select_requests_total- total requests. You can calculate request rate (qps) by using this metric
-
vmstoragevm_tenant_active_timeseries- the number of active timeseriesvm_tenant_used_tenant_bytes- the disk spaces is consumed by metrics for particular tenantvm_tenant_timeseries_created_total- the total number for timeseries by tenant
The information should be scrapped by the agent (vmagent, victoriametrics, prometheus, etc) and stored in TSDB. This can be the same cluster but a different tenant, but we encourage to use one more instance of TSDB (more lightweight, eg. VM single) for monitoring of monitoring.
the config example for statistic scrapping
scrape_configs:
  - job_name: cluster
    scrape_interval: 10s
    static_configs:
    - targets: ['vmselect:8481','vmstorage:8482','vminsert:8480']
Visualization
Visualisation of statistic can be done in grafana using this dashboard link
Integration with vmgateway:
Per Tenant Statistic is the source data for vmgateway rate limiter. More information can be found here
Integration with vmalert:
You can generate alerts based on each tenant resource usage and notify the system/people about reaching the limits.
here is an example of alert by high churn rate by the tenant
- alert: TooHighChurnRate
  expr: |
    (
    sum(rate(vm_tenant_timeseries_created_total[5m])) by(accountID,projectID)
    /
    sum(rate(vm_tenant_inserted_rows_total[5m])) by(accountID,projectID)
    ) > 0.1
  for: 15m
  labels:
    severity: warning
  annotations:
    summary: "Churn rate is more than 10% for the last 15m"
    description: "VM constantly creates new time series at tenant: {{ $labels.accountID }}:{{ $labels.projectID }}.\n
            This effect is known as Churn Rate.\n
            High Churn Rate tightly connected with database performance and may
            result in unexpected OOM's or slow queries."