2.6 KiB
| sort |
|---|
| 19 |
VictoriaMetrics Cluster Per Tenant Statistic

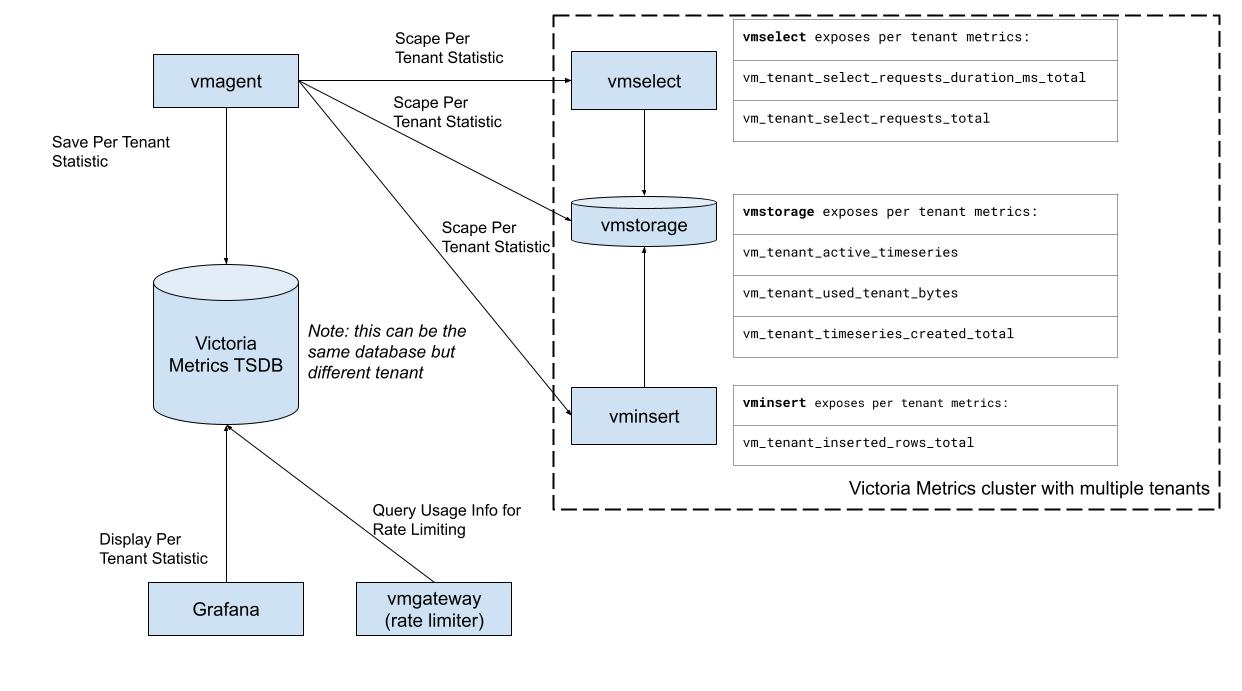
The enterprise version of VictoriaMetrics cluster exposes the usage statistics for each tenant.
When the next statistic is exposed:
-
vminsertvm_tenant_inserted_rows_total- the ingestion rate by tenant
-
vmselectvm_tenant_select_requests_duration_ms_total- query latency by tenant. It can be useful to identify the tenant with the heaviest queriesvm_tenant_select_requests_total- total requests. You can calculate request rate (qps) with this metric
-
vmstoragevm_tenant_active_timeseries- the number of active timeseriesvm_tenant_used_tenant_bytes- the disk space consumed by the metrics for a particular tenantvm_tenant_timeseries_created_total- the total number for timeseries by tenant
The information should be scraped by the agent (vmagent, victoriametrics, prometheus, etc) and stored in the TSDB. This can be the same cluster but a different tenant however, we encourage the use of one more instance of TSDB (more lightweight, eg. VM single) for the monitoring of monitoring.
the config example for statistic scraping
scrape_configs:
  - job_name: cluster
    scrape_interval: 10s
    static_configs:
    - targets: ['vmselect:8481','vmstorage:8482','vminsert:8480']
Visualization
Visualisation of statistics can be done in Grafana using this dashboard link
Integration with vmgateway
Per Tenant Statistics are the source data for the vmgateway rate limiter. More information can be found here
Integration with vmalert
You can generate alerts based on each tenants' resource usage and notify the system/users that they are reaching the limits.
Here is an example of an alert for high churn rate by the tenant
- alert: TooHighChurnRate
  expr: |
    (
    sum(rate(vm_tenant_timeseries_created_total[5m])) by(accountID,projectID)
    /
    sum(rate(vm_tenant_inserted_rows_total[5m])) by(accountID,projectID)
    ) > 0.1
  for: 15m
  labels:
    severity: warning
  annotations:
    summary: "Churn rate is more than 10% for the last 15m"
    description: "VM constantly creates new time series in the tenant: {{ $labels.accountID }}:{{ $labels.projectID }}.\n
            This effect is known as Churn Rate.\n
            High Churn Rate is tightly connected with database performance and may
            result in unexpected OOM's or slow queries."