The changes are based on SEO report and supposed to improve
ranking and indexation by search engines by using prompt and unique titles
and by updating unreachable links.

It also updates links to have a simplified form and replaces relative links with absolute links
according to https://docs.victoriametrics.com/#documentation

---------

Co-authored-by: Roman Khavronenko <roman@victoriametrics.com>
(cherry picked from commit 2e16732fdb)
16 KiB
| weight | title | menu | aliases | |||||||
|---|---|---|---|---|---|---|---|---|---|---|
| 9 | HA monitoring setup in Kubernetes via VictoriaMetrics Cluster |
|
|
The guide covers:
- High availability monitoring via VictoriaMetrics cluster in Kubernetes with Helm charts
- How to store metrics
- How to scrape metrics from k8s components using a service discovery
- How to visualize stored data
- How to store metrics in VictoriaMetrics
Preconditions
- Kubernetes cluster 1.19.12-gke.2100. We use GKE cluster from GCP but this guide also applies to any Kubernetes cluster. For example, Amazon EKS.
- Helm 3
- kubectl 1.21
- jq tool
1. VictoriaMetrics Helm repository
Please see the relevant VictoriaMetrics Helm repository section in previous guides.
2. Install VictoriaMetrics Cluster from the Helm chart
Execute the following command in your terminal:
cat <<EOF | helm install vmcluster vm/victoria-metrics-cluster -f -
vmselect:
  extraArgs:
    dedup.minScrapeInterval: 1ms
    replicationFactor: 2
  podAnnotations:
    prometheus.io/scrape: "true"
    prometheus.io/port: "8481"
  replicaCount: 3

vminsert:
  extraArgs:
    replicationFactor: 2
  podAnnotations:
    prometheus.io/scrape: "true"
    prometheus.io/port: "8480"
  replicaCount: 3

vmstorage:
  podAnnotations:
    prometheus.io/scrape: "true"
    prometheus.io/port: "8482"
  replicaCount: 3
EOF
- The
Helm install vmcluster vm/victoria-metrics-clustercommand installs VictoriaMetrics cluster to the default namespace. dedup.minScrapeInterval: 1msconfigures de-duplication for the cluster that de-duplicates data points in the same time series if they fall within the same discrete 1ms bucket. The earliest data point will be kept. In the case of equal timestamps, an arbitrary data point will be kept.replicationFactor: 2Replication factor for the ingested data, i.e. how many copies should be made among distinct-storageNodeinstances. If the replication factor is greater than one, the deduplication must be enabled on the remote storage side.podAnnotations: prometheus.io/scrape: "true"enables the scraping of metrics from the vmselect, vminsert and vmstorage pods.podAnnotations:prometheus.io/port: "some_port"enables the scraping of metrics from the vmselect, vminsert and vmstorage pods from corresponding ports.replicaCount: 3creates three replicas of vmselect, vminsert and vmstorage.
The expected result of the command execution is the following:
NAME: vmcluster
LAST DEPLOYED: Thu Jul 29 13:33:51 2021
NAMESPACE: default
STATUS: deployed
REVISION: 1
TEST SUITE: None
NOTES:
Write API:

The VictoriaMetrics write api can be accessed via port 8480 via the following DNS name from within your cluster:
vmcluster-victoria-metrics-cluster-vminsert.default.svc.cluster.local

Get the VictoriaMetrics insert service URL by running these commands in the same shell:
  export POD_NAME=$(kubectl get pods --namespace default -l "app=vminsert" -o jsonpath="{.items[0].metadata.name}")
  kubectl --namespace default port-forward $POD_NAME 8480

You need to update your Prometheus configuration file and add the following lines to it:

prometheus.yml

    remote_write:
      - url: "http://<insert-service>/insert/0/prometheus/"


for example -  inside the Kubernetes cluster:

    remote_write:
      - url: "http://vmcluster-victoria-metrics-cluster-vminsert.default.svc.cluster.local:8480/insert/0/prometheus/"
Read API:

The VictoriaMetrics read api can be accessed via port 8481 with the following DNS name from within your cluster:
vmcluster-victoria-metrics-cluster-vmselect.default.svc.cluster.local

Get the VictoriaMetrics select service URL by running these commands in the same shell:
  export POD_NAME=$(kubectl get pods --namespace default -l "app=vmselect" -o jsonpath="{.items[0].metadata.name}")
  kubectl --namespace default port-forward $POD_NAME 8481

You need to specify select service URL into your Grafana:
 NOTE: you need to use the Prometheus Data Source

Input this URL field into Grafana

    http://<select-service>/select/0/prometheus/


for example - inside the Kubernetes cluster:

    http://vmcluster-victoria-metrics-cluster-vmselect.default.svc.cluster.local:8481/select/0/prometheus/"
Verify that the VictoriaMetrics cluster pods are up and running by executing the following command:
kubectl get pods | grep vmcluster
The expected output is:
vmcluster-victoria-metrics-cluster-vminsert-78b84d8cd9-4mh9d   1/1     Running   0          2m28s
vmcluster-victoria-metrics-cluster-vminsert-78b84d8cd9-4ppl7   1/1     Running   0          2m28s
vmcluster-victoria-metrics-cluster-vminsert-78b84d8cd9-782qk   1/1     Running   0          2m28s
vmcluster-victoria-metrics-cluster-vmselect-69c5f48bc6-4v4ws   1/1     Running   0          2m27s
vmcluster-victoria-metrics-cluster-vmselect-69c5f48bc6-kwc7q   1/1     Running   0          2m28s
vmcluster-victoria-metrics-cluster-vmselect-69c5f48bc6-v7pmk   1/1     Running   0          2m28s
vmcluster-victoria-metrics-cluster-vmstorage-0                 1/1     Running   0          2m27s
vmcluster-victoria-metrics-cluster-vmstorage-1                 1/1     Running   0          2m3s
vmcluster-victoria-metrics-cluster-vmstorage-2                 1/1     Running   0          99s
3. Install vmagent from the Helm chart
To scrape metrics from Kubernetes with a VictoriaMetrics Cluster we will need to install vmagent with some additional configurations. To do so, please run the following command:
helm install vmagent vm/victoria-metrics-agent -f https://docs.victoriametrics.com/guides/guide-vmcluster-vmagent-values.yaml
Here is full file content guide-vmcluster-vmagent-values.yaml
remoteWriteUrls:
   - http://vmcluster-victoria-metrics-cluster-vminsert.default.svc.cluster.local:8480/insert/0/prometheus/

scrape_configs:
    - job_name: vmagent
      static_configs:
        - targets: ["localhost:8429"]
    - job_name: "kubernetes-apiservers"
      kubernetes_sd_configs:
        - role: endpoints
      scheme: https
      tls_config:
        ca_file: /var/run/secrets/kubernetes.io/serviceaccount/ca.crt
        insecure_skip_verify: true
      bearer_token_file: /var/run/secrets/kubernetes.io/serviceaccount/token
      relabel_configs:
        - source_labels:
            [
              __meta_kubernetes_namespace,
              __meta_kubernetes_service_name,
              __meta_kubernetes_endpoint_port_name,
            ]
          action: keep
          regex: default;kubernetes;https
    - job_name: "kubernetes-nodes"
      scheme: https
      tls_config:
        ca_file: /var/run/secrets/kubernetes.io/serviceaccount/ca.crt
        insecure_skip_verify: true
      bearer_token_file: /var/run/secrets/kubernetes.io/serviceaccount/token
      kubernetes_sd_configs:
        - role: node
      relabel_configs:
        - action: labelmap
          regex: __meta_kubernetes_node_label_(.+)
        - target_label: __address__
          replacement: kubernetes.default.svc:443
        - source_labels: [__meta_kubernetes_node_name]
          regex: (.+)
          target_label: __metrics_path__
          replacement: /api/v1/nodes/$1/proxy/metrics
    - job_name: "kubernetes-nodes-cadvisor"
      scheme: https
      tls_config:
        ca_file: /var/run/secrets/kubernetes.io/serviceaccount/ca.crt
        insecure_skip_verify: true
      bearer_token_file: /var/run/secrets/kubernetes.io/serviceaccount/token
      kubernetes_sd_configs:
        - role: node
      relabel_configs:
        - action: labelmap
          regex: __meta_kubernetes_node_label_(.+)
        - target_label: __address__
          replacement: kubernetes.default.svc:443
        - source_labels: [__meta_kubernetes_node_name]
          regex: (.+)
          target_label: __metrics_path__
          replacement: /api/v1/nodes/$1/proxy/metrics/cadvisor
      metric_relabel_configs:
        - action: replace
          source_labels: [pod]
          regex: '(.+)'
          target_label: pod_name
          replacement: '${1}'
        - action: replace
          source_labels: [container]
          regex: '(.+)'
          target_label: container_name
          replacement: '${1}'
        - action: replace
          target_label: name
          replacement: k8s_stub
        - action: replace
          source_labels: [id]
          regex: '^/system\.slice/(.+)\.service$'
          target_label: systemd_service_name
          replacement: '${1}'
remoteWriteUrls: - http://vmcluster-victoria-metrics-cluster-vminsert.default.svc.cluster.local:8480/insert/0/prometheus/configuresvmagentto write scraped metrics to thevmselect service.- The
metric_relabel_configssection allows you to process Kubernetes metrics for the Grafana dashboard.
Verify that vmagent's pod is up and running by executing the following command:
kubectl get pods | grep vmagent
The expected output is:
vmagent-victoria-metrics-agent-57ddbdc55d-h4ljb 1/1 Running 0 13s
4. Verifying HA of VictoriaMetrics Cluster
Run the following command to check that VictoriaMetrics services are up and running:
kubectl get pods | grep victoria-metrics
The expected output is:
vmagent-victoria-metrics-agent-57ddbdc55d-h4ljb                1/1     Running   0          75s
vmcluster-victoria-metrics-cluster-vminsert-78b84d8cd9-s8v7x   1/1     Running   0          89s
vmcluster-victoria-metrics-cluster-vminsert-78b84d8cd9-xlm9d   1/1     Running   0          89s
vmcluster-victoria-metrics-cluster-vminsert-78b84d8cd9-xqxrh   1/1     Running   0          89s
vmcluster-victoria-metrics-cluster-vmselect-69c5f48bc6-7dg95   1/1     Running   0          89s
vmcluster-victoria-metrics-cluster-vmselect-69c5f48bc6-ck7qb   1/1     Running   0          89s
vmcluster-victoria-metrics-cluster-vmselect-69c5f48bc6-jjqsl   1/1     Running   0          89s
vmcluster-victoria-metrics-cluster-vmstorage-0                 1/1     Running   0          89s
vmcluster-victoria-metrics-cluster-vmstorage-1                 1/1     Running   0          63s
vmcluster-victoria-metrics-cluster-vmstorage-2                 1/1     Running   0          34s
To verify that metrics are present in the VictoriaMetrics send a curl request to the vmselect service from kubernetes or setup Grafana and check it via the web interface.
Run the following command to see the list of services:
kubectl get svc | grep vmselect
The expected output:
vmcluster-victoria-metrics-cluster-vmselect ClusterIP 10.88.2.69 <none> 8481/TCP 1m
Run the following command to make vmselect's port accessible from the local machine:
kubectl port-forward svc/vmcluster-victoria-metrics-cluster-vmselect 8481:8481
Execute the following command to get metrics via curl:
curl -sg 'http://127.0.0.1:8481/select/0/prometheus/api/v1/query_range?query=count(up{kubernetes_pod_name=~".*vmselect.*"})&start=-10m&step=1m' | jq
The expected output is:
{
  "status": "success",
  "isPartial": false,
  "data": {
    "resultType": "matrix",
    "result": [
      {
        "metric": {},
        "values": [
          [
            1628065480.657,
            "3"
          ],
          [
            1628065540.657,
            "3"
          ],
          [
            1628065600.657,
            "3"
          ],
          [
            1628065660.657,
            "3"
          ],
          [
            1628065720.657,
            "3"
          ],
          [
            1628065780.657,
            "3"
          ],
          [
            1628065840.657,
            "3"
          ]
        ]
      }
    ]
  }
}
- Query
http://127.0.0.1:8481/select/0/prometheus/api/v1/query_rangeuses VictoriaMetrics querying API to fetch previously stored data points; - Argument
query=count(up{kubernetes_pod_name=~".*vmselect.*"})specifies the query we want to execute. Specifically, we calculate the number ofvmselectpods. - Additional arguments
start=-10m&step=1m'set requested time range from -10 minutes (10 minutes ago) to now (default value ifendargument is omitted) and step (the distance between returned data points) of 1 minute; - By adding
| jqwe pass the output to the jq utility which outputs information in json format
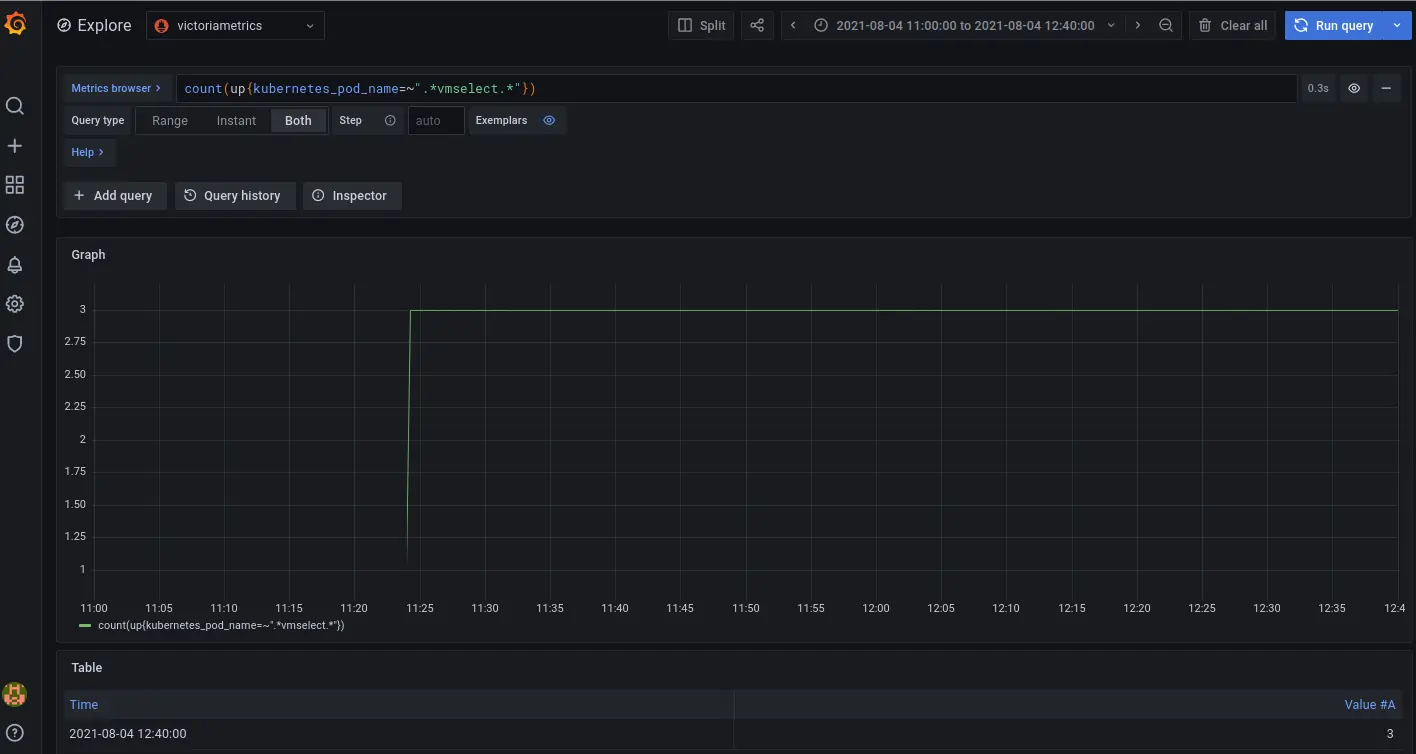
The expected result of the query count(up{kubernetes_pod_name=~".*vmselect.*"}) should be equal to 3 - the number of replicas we set via replicaCount parameter.
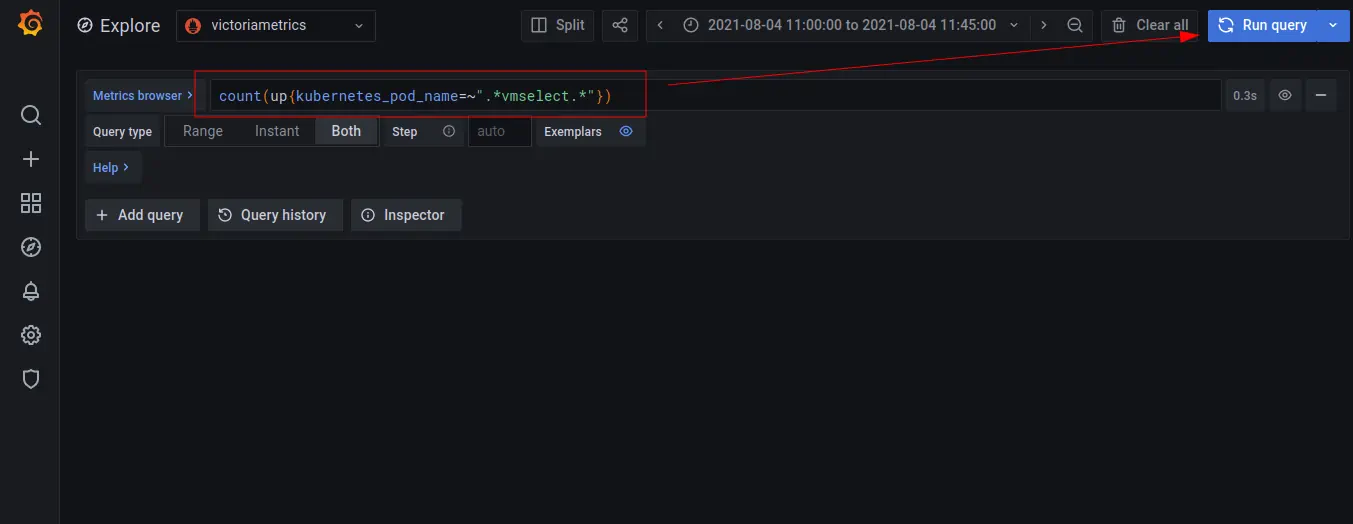
To test via Grafana, we need to install it first. Install and connect Grafana to VictoriaMetrics, login into Grafana and open the metrics explore page at http://127.0.0.1:3000/explore.
Choose victoriametrics from the list of datasources and enter count(up{kubernetes_pod_name=~".*vmselect.*"}) to the Metric browser field as shown on the screenshot, then press Run query button:
The expected output is:
5. High Availability
To test if High Availability works, we need to shutdown one of the vmstorages. To do this, run the following command:
kubectl scale sts vmcluster-victoria-metrics-cluster-vmstorage --replicas=2
Verify that now we have two running vmstorages in the cluster by executing the following command:
kubectl get pods | grep vmstorage
The expected output is:
vmcluster-victoria-metrics-cluster-vmstorage-0                 1/1     Running   0          44m
vmcluster-victoria-metrics-cluster-vmstorage-1                 1/1     Running   0          43m
Return to Grafana Explore and press the Run query button again.
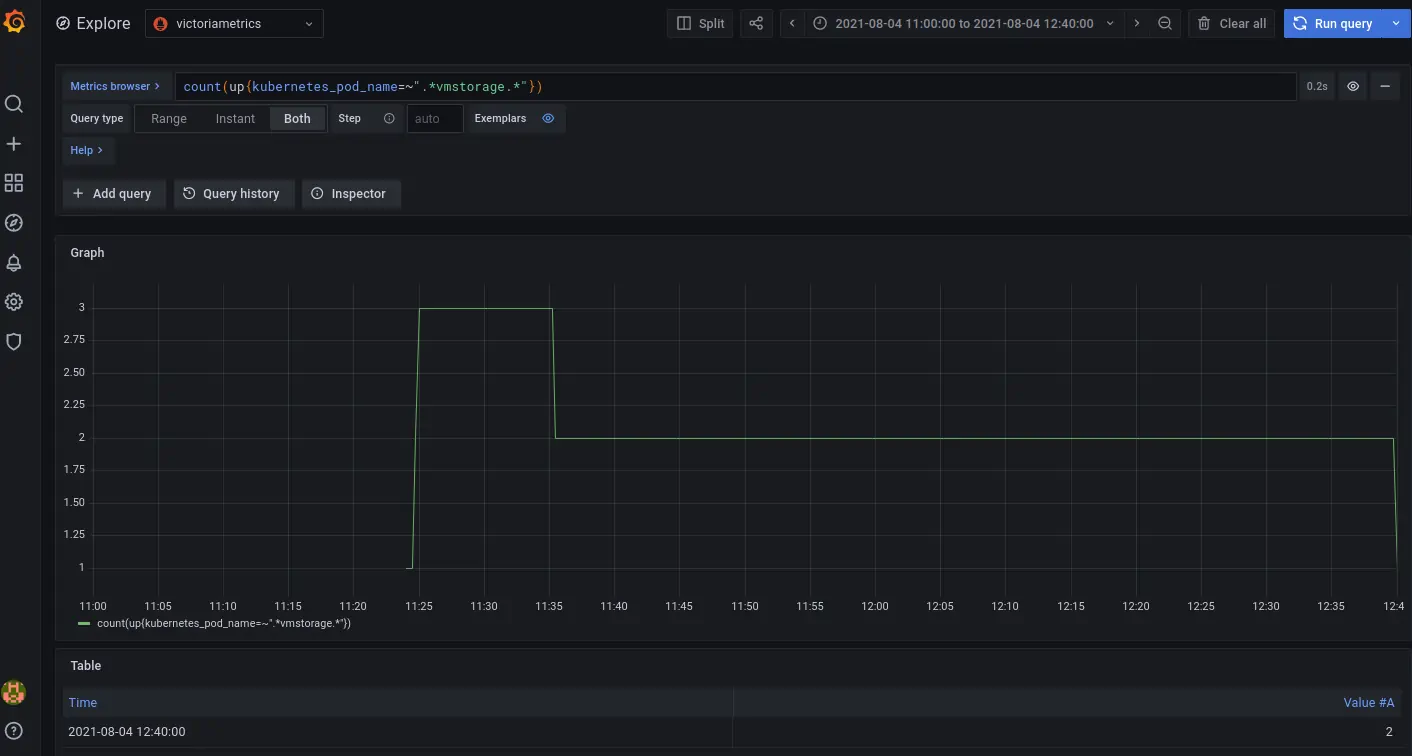
The expected output is:
As you can see, after we scaled down the vmstorage replicas number from three to two pods, metrics are still available and correct. The response is not partial as it was before scaling. Also we see that query count(up{kubernetes_pod_name=~".*vmselect.*"}) returns the same value as before.
To confirm that the number of vmstorage pods is equivalent to two, execute the following request in Grafana Explore:
6. Final thoughts
- We set up VictoriaMetrics for Kubernetes cluster with HA.
- We collected metrics from running services and stored them in the VictoriaMetrics database.
- We configured
dedup.minScrapeIntervalandreplicationFactor: 2for VictoriaMetrics cluster for high availability purposes. - We tested and made sure that metrics are available even if one of
vmstoragesnodes was turned off.


