18 KiB
| sort | weight | title | menu | ||||||
|---|---|---|---|---|---|---|---|---|---|
| 1 | 1 | QuickStart |
|
VictoriaMetrics Operator QuickStart
VictoriaMetrics Operator serves to make running VictoriaMetrics applications on top of Kubernetes as easy as possible while preserving Kubernetes-native configuration options.
The shortest way to deploy full-stack monitoring cluster with VictoriaMetrics Operator is to use Helm-chart victoria-metrics-k8s-stack.
Also you can follow the other steps in documentation to use VictoriaMetrics Operator:
- Setup
- Security
- Configuration
- Migration from Prometheus
- Monitoring
- Authorization and exposing components
- High Availability
- Enterprise
- Custom resources
- FAQ (Frequency Asked Questions)
But if you want to deploy VictoriaMetrics Operator quickly from scratch (without using templating for custom resources), you can follow this guide:
Let's start!
Setup operator
You can find out how to and instructions for installing the VictoriaMetrics operator into your kubernetes cluster on the Setup page.
Here we will elaborate on just one of the ways - for instance, we will install operator via Helm-chart victoria-metrics-operator:
Add repo with helm-chart:
helm repo add vm https://victoriametrics.github.io/helm-charts/
helm repo update
Render values.yaml with default operator configuration:
helm show values vm/victoria-metrics-operator > values.yaml
Now you can configure operator - open rendered values.yaml file in your text editor. For example:
code values.yaml
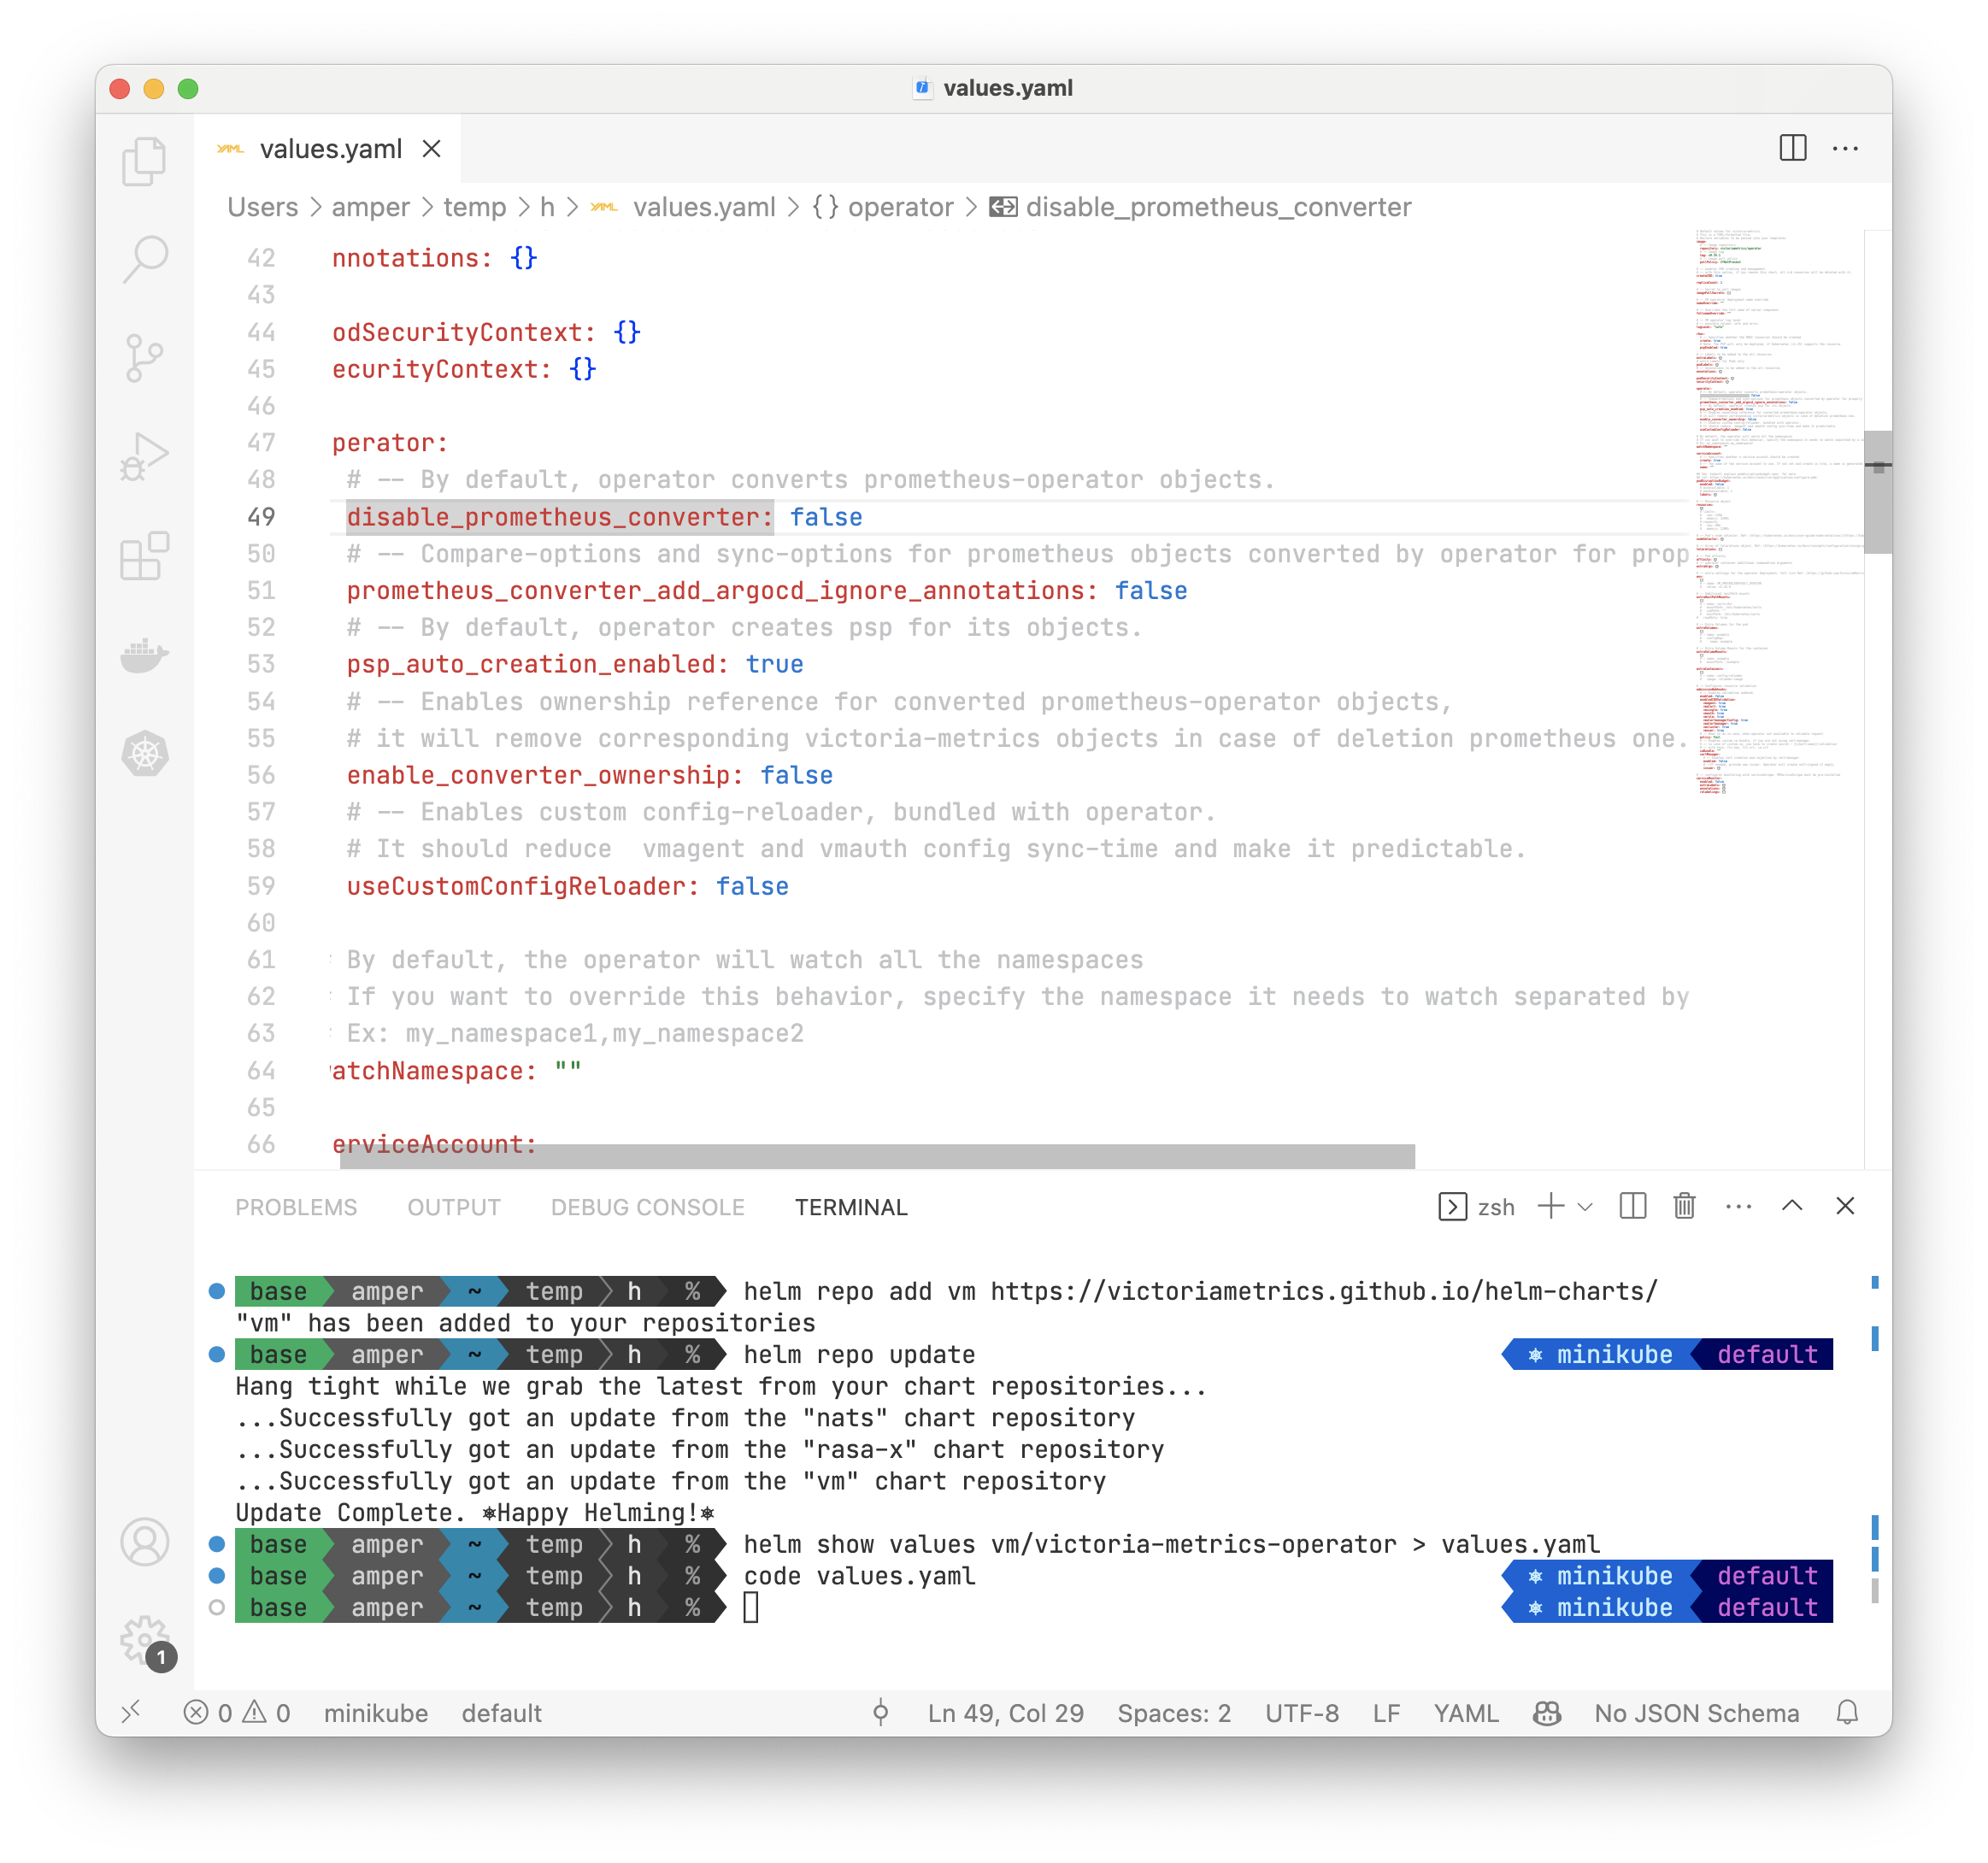
Now you can change configuration in values.yaml. For more details about configuration options and methods,
see configuration -> victoria-metrics-operator.
If you migrated from prometheus-operator, you can read about prometheus-operator objects conversion on the migration from prometheus-operator.
Since we're looking at installing from scratch, let's disable prometheus-operator objects conversion,
and also let's set some resources for operator in values.yaml:
# ...

operator:
  # -- By default, operator converts prometheus-operator objects.
  disable_prometheus_converter: true

# -- Resources for operator
resources:
  limits:
    cpu: 500m
    memory: 500Mi
  requests:
    cpu: 100m
    memory: 150Mi

# ...
You will need a kubernetes namespace to deploy the operator and VM components. Let's create it:
kubectl create namespace vm
After finishing with values.yaml and creating namespace, you can test the installation with command:
helm install vmoperator vm/victoria-metrics-operator -f values.yaml -n vm --debug --dry-run
Where vm is the namespace where you want to install operator.
If everything is ok, you can install operator with command:
helm install vmoperator vm/victoria-metrics-operator -f values.yaml -n vm

# NAME: vmoperator
# LAST DEPLOYED: Thu Sep 14 15:13:04 2023
# NAMESPACE: vm
# STATUS: deployed
# REVISION: 1
# TEST SUITE: None
# NOTES:
# victoria-metrics-operator has been installed. Check its status by running:
#   kubectl --namespace vm get pods -l "app.kubernetes.io/instance=vmoperator"
#
# Get more information on https://github.com/VictoriaMetrics/helm-charts/tree/master/charts/victoria-metrics-operator.
# See "Getting started guide for VM Operator" on https://docs.victoriametrics.com/guides/getting-started-with-vm-operator.html .
And check that operator is running:
kubectl get pods -n vm -l "app.kubernetes.io/instance=vmoperator"

# NAME                                                    READY   STATUS    RESTARTS   AGE
# vmoperator-victoria-metrics-operator-7b88bd6df9-q9qwz   1/1     Running   0          98s
Deploy components
Now you can create instances of VictoriaMetrics applications.
Let's create fullstack monitoring cluster with
vmagent,
vmauth,
vmalert,
vmalertmanager,
vmcluster
(a component for deploying a cluster version of
VictoriaMetrics
consisting of vmstorage, vmselect and vminsert):
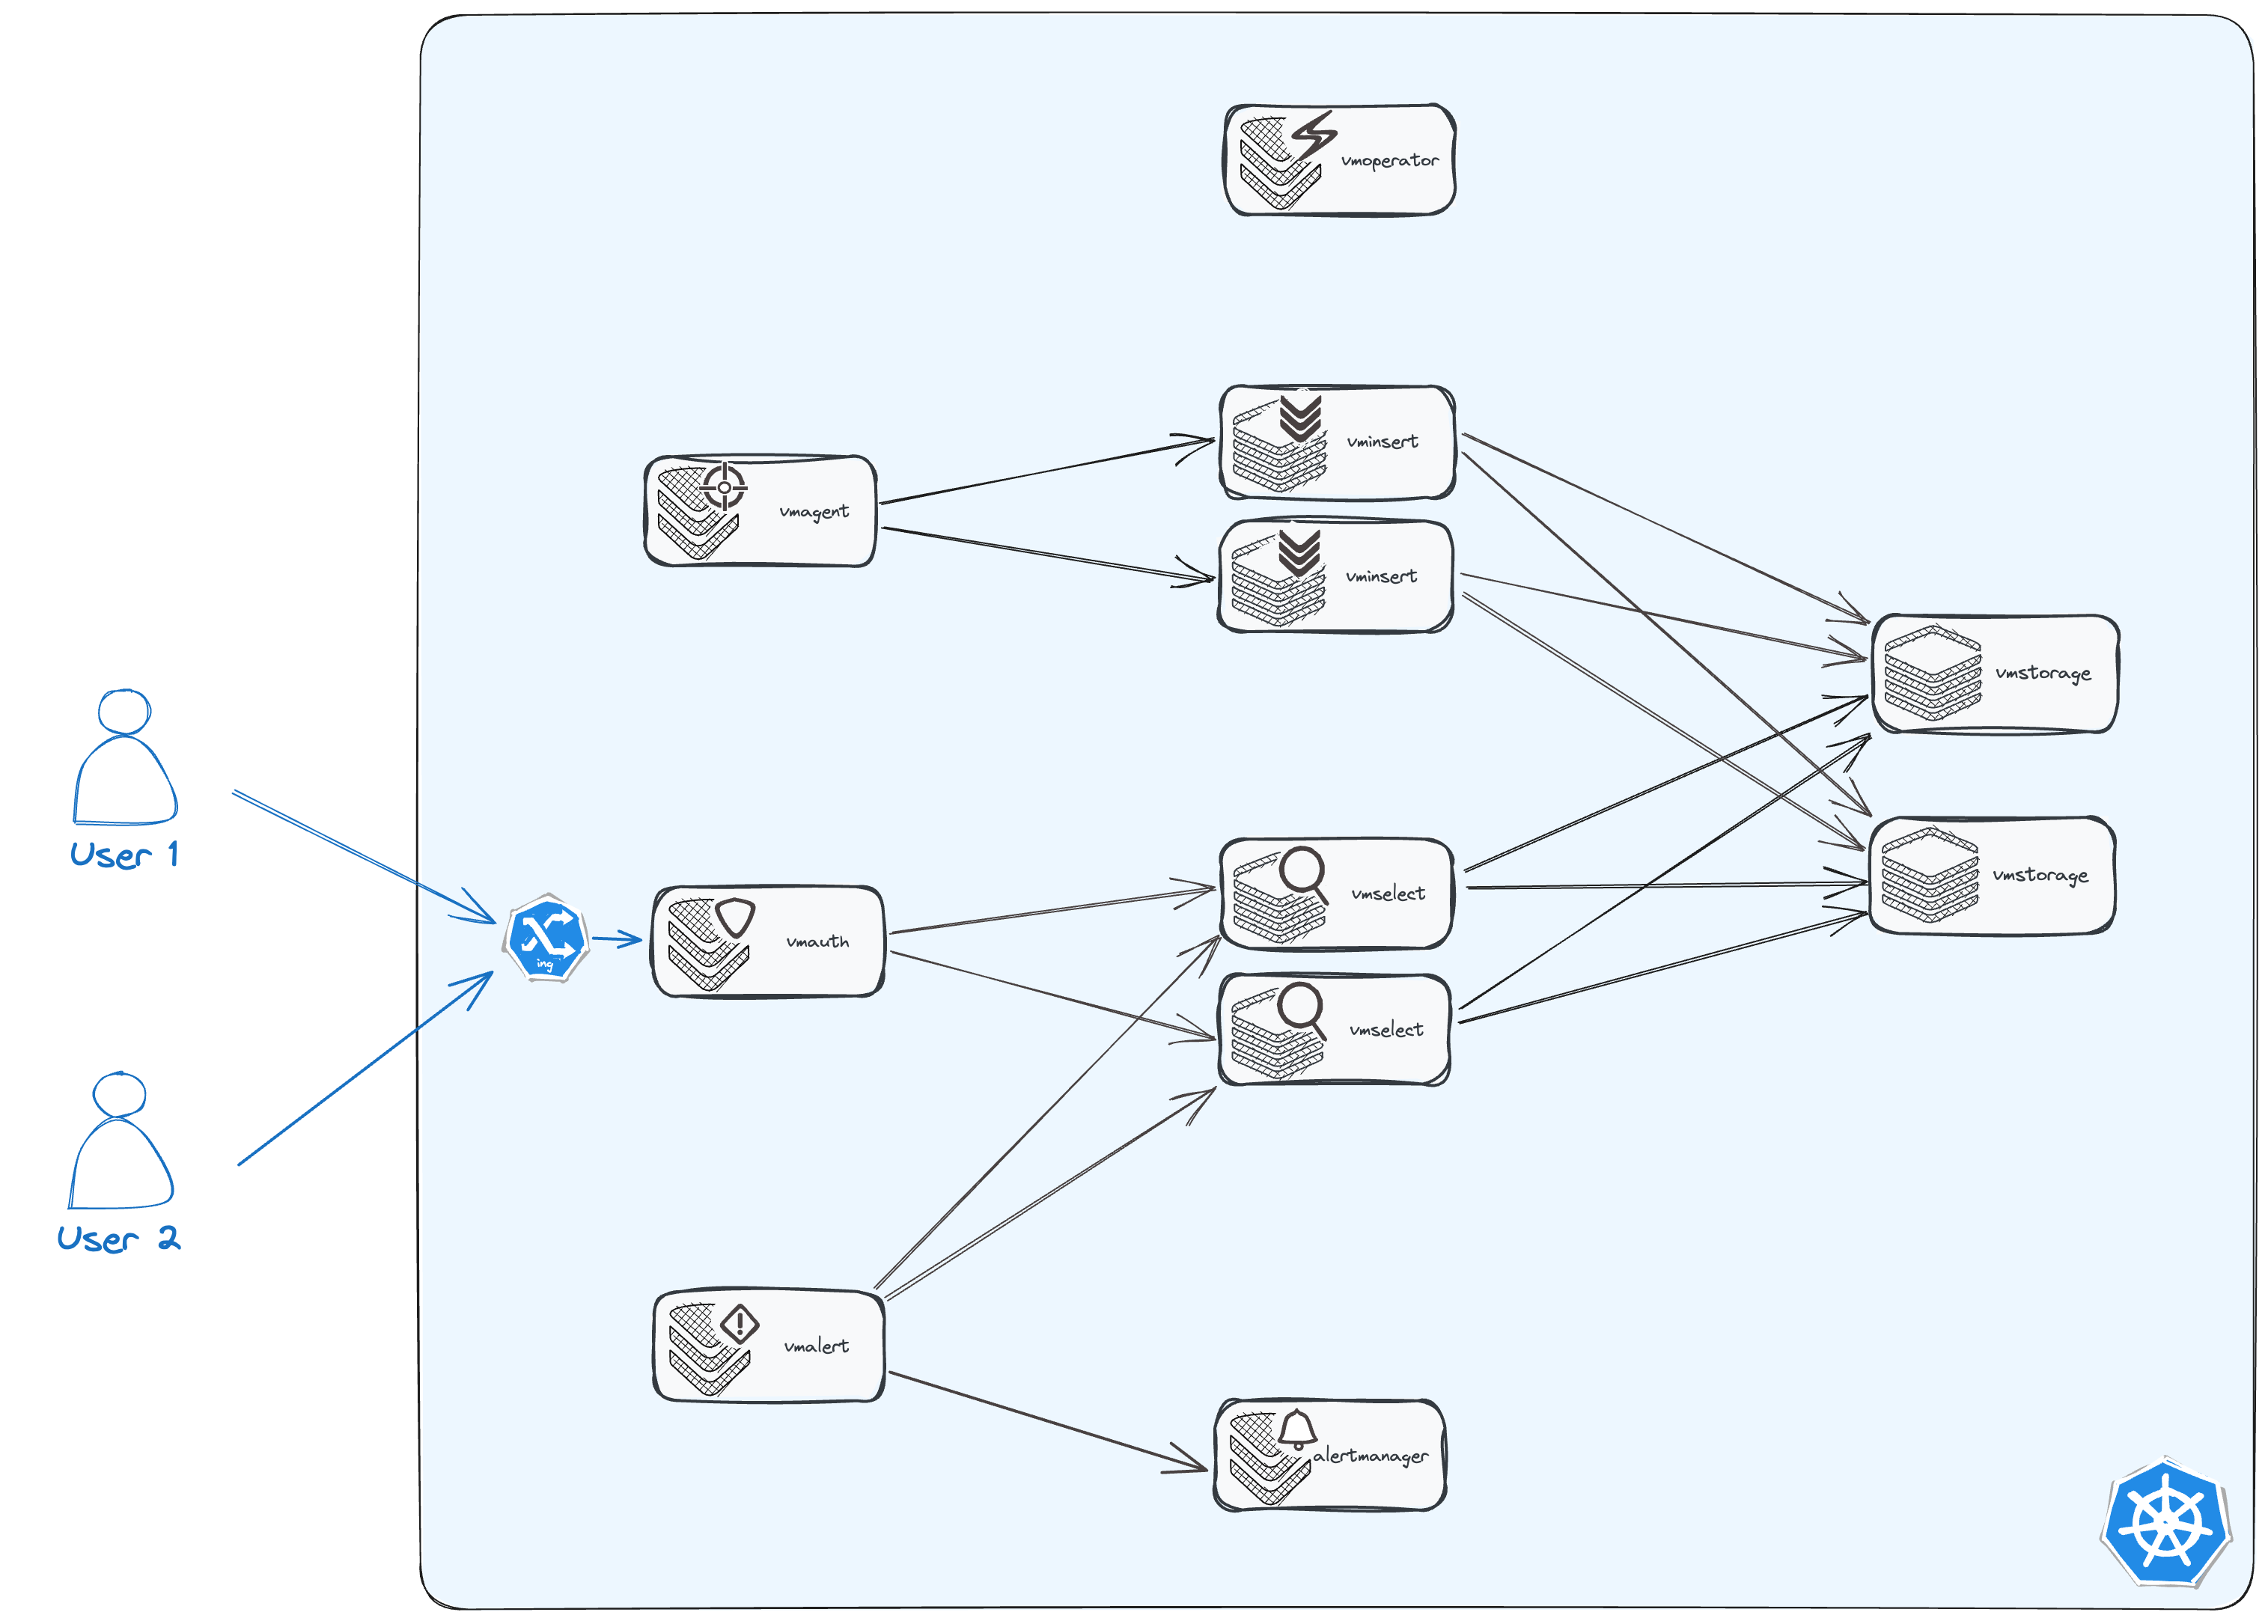
More details about resources of VictoriaMetrics operator you can find on the resources page.
VMCluster (vmselect, vminsert, vmstorage)
Let's start by deploying the vmcluster resource.
Create file vmcluster.yaml
code vmcluster.yaml
with the following content:
# vmcluster.yaml
apiVersion: operator.victoriametrics.com/v1beta1
kind: VMCluster
metadata:
  name: demo
spec:
  retentionPeriod: "1"
  replicationFactor: 2
  vmstorage:
    replicaCount: 2
    storageDataPath: "/vm-data"
    storage:
      volumeClaimTemplate:
        spec:
          resources:
            requests:
              storage: "10Gi"
    resources:
      limits:
        cpu: "1"
        memory: "1Gi"
  vmselect:
    replicaCount: 2
    cacheMountPath: "/select-cache"
    storage:
      volumeClaimTemplate:
        spec:
          resources:
            requests:
              storage: "1Gi"
    resources:
      limits:
        cpu: "1"
        memory: "1Gi"
      requests:
        cpu: "0.5"
        memory: "500Mi"
  vminsert:
    replicaCount: 2
    resources:
      limits:
        cpu: "1"
        memory: "1Gi"
      requests:
        cpu: "0.5"
        memory: "500Mi"
After that you can deploy vmcluster resource to the kubernetes cluster:
kubectl apply -f vmcluster.yaml -n vm

# vmcluster.operator.victoriametrics.com/demo created
Check that vmcluster is running:
kubectl get pods -n vm -l "app.kubernetes.io/instance=demo"

# NAME                             READY   STATUS    RESTARTS   AGE
# vminsert-demo-8688d88ff7-fnbnw   1/1     Running   0          3m39s
# vminsert-demo-8688d88ff7-5wbj7   1/1     Running   0          3m39s
# vmselect-demo-0                  1/1     Running   0          3m39s
# vmselect-demo-1                  1/1     Running   0          3m39s
# vmstorage-demo-1                 1/1     Running   0          22s
# vmstorage-demo-0                 1/1     Running   0          6s
Now you can see that 6 components of your demo vmcluster is running.
In addition, you can see that the operator created services for each of the component type:
kubectl get svc -n vm -l "app.kubernetes.io/instance=demo"

# NAME             TYPE        CLUSTER-IP        EXTERNAL-IP   PORT(S)                      AGE
# vmstorage-demo   ClusterIP   None              <none>        8482/TCP,8400/TCP,8401/TCP   8m3s
# vmselect-demo    ClusterIP   None              <none>        8481/TCP                     8m3s
# vminsert-demo    ClusterIP   192.168.194.183   <none>        8480/TCP                     8m3s
We'll need them in the next steps.
More information about vmcluster resource you can find on
the vmcluster page.
Scraping
VMAgent
Now let's deploy vmagent resource.
Create file vmagent.yaml
code vmagent.yaml
with the following content:
apiVersion: operator.victoriametrics.com/v1beta1
kind: VMAgent
metadata:
  name: demo
spec:
  selectAllByDefault: true
  remoteWrite:
    - url: "http://vminsert-demo.vm.svc:8480/insert/0/prometheus/api/v1/write"
After that you can deploy vmagent resource to the kubernetes cluster:
kubectl apply -f vmagent.yaml -n vm

# vmagent.operator.victoriametrics.com/demo created
Check that vmagent is running:
kubectl get pods -n vm -l "app.kubernetes.io/instance=demo" -l "app.kubernetes.io/name=vmagent"

# NAME                            READY   STATUS    RESTARTS   AGE
# vmagent-demo-6785f7d7b9-zpbv6   2/2     Running   0          72s
More information about vmagent resource you can find on
the vmagent page.
VMServiceScrape
Now we have the timeseries database (vmcluster) and the tool to collect metrics (vmagent) and send it to the database.
But we need to tell vmagent what metrics to collect. For this we will use vmservicescrape resource
or other *scrape resources.
By default, operator creates vmservicescrape resource for each component that it manages. More details about this you can find on
the monitoring page.
For instance, we can create vmservicescrape for VictoriaMetrics operator manually. Let's create file vmservicescrape.yaml:
code vmservicescrape.yaml
with the following content:
apiVersion: operator.victoriametrics.com/v1beta1
kind: VMServiceScrape
metadata:
  name: vmoperator-demo
spec:
  selector:
    matchLabels:
      app.kubernetes.io/instance: vmoperator
      app.kubernetes.io/name: victoria-metrics-operator
  namespaceSelector:
    matchNames:
      - vm
After that you can deploy vmservicescrape resource to the kubernetes cluster:
kubectl apply -f vmservicescrape.yaml -n vm

# vmservicescrape.operator.victoriametrics.com/vmoperator-demo created
Access
We need to look at the results of what we got. Up until now, we've just been looking only at the status of the pods.
VMAuth
Let's expose our components with vmauth.
Create file vmauth.yaml
code vmauth.yaml
with the following content:
apiVersion: operator.victoriametrics.com/v1beta1
kind: VMAuth
metadata:
  name: demo
spec:
  userNamespaceSelector: {}
  userSelector: {}
  ingress:
    class_name: nginx # <-- change this to your ingress-controller
    host: vm-demo.k8s.orb.local # <-- change this to your domain
Note that content of ingress field depends on your ingress-controller and domain.
Your cluster will have them differently.
Also, for simplicity, we don't use tls, but in real environments not having tls is unsafe.
VMUser
To get authorized access to our data it is necessary to create a user using the vmuser resource.
Create file vmuser.yaml
code vmuser.yaml
with the following content:
apiVersion: operator.victoriametrics.com/v1beta1
kind: VMUser
metadata:
  name: demo
spec:
    name: demo
    username: demo
    generatePassword: true
    targetRefs:
      # vmui + vmselect
      - crd:
          kind: VMCluster/vmselect
          name: demo
          namespace: vm
        target_path_suffix: "/select/0"
        paths:
          - "/vmui"
          - "/vmui/.*"
          - "/prometheus/api/v1/query"
          - "/prometheus/api/v1/query_range"
          - "/prometheus/api/v1/series"
          - "/prometheus/api/v1/label/"
          - "/prometheus/api/v1/label/[^/]+/values"
After that you can deploy vmauth and vmuser resources to the kubernetes cluster:
kubectl apply -f vmauth.yaml -n vm
kubectl apply -f vmuser.yaml -n vm

# vmauth.operator.victoriametrics.com/demo created
# vmuser.operator.victoriametrics.com/demo created
Operator automatically creates a secret with username/password token for VMUser resource with generatePassword=true:
kubectl get secret -n vm -l "app.kubernetes.io/instance=demo" -l "app.kubernetes.io/name=vmuser"

# NAME          TYPE     DATA   AGE
# vmuser-demo   Opaque   3      29m
You can get password for your user with command:
kubectl get secret -n vm vmuser-demo -o jsonpath="{.data.password}" | base64 --decode

# Yt3N2r3cPl
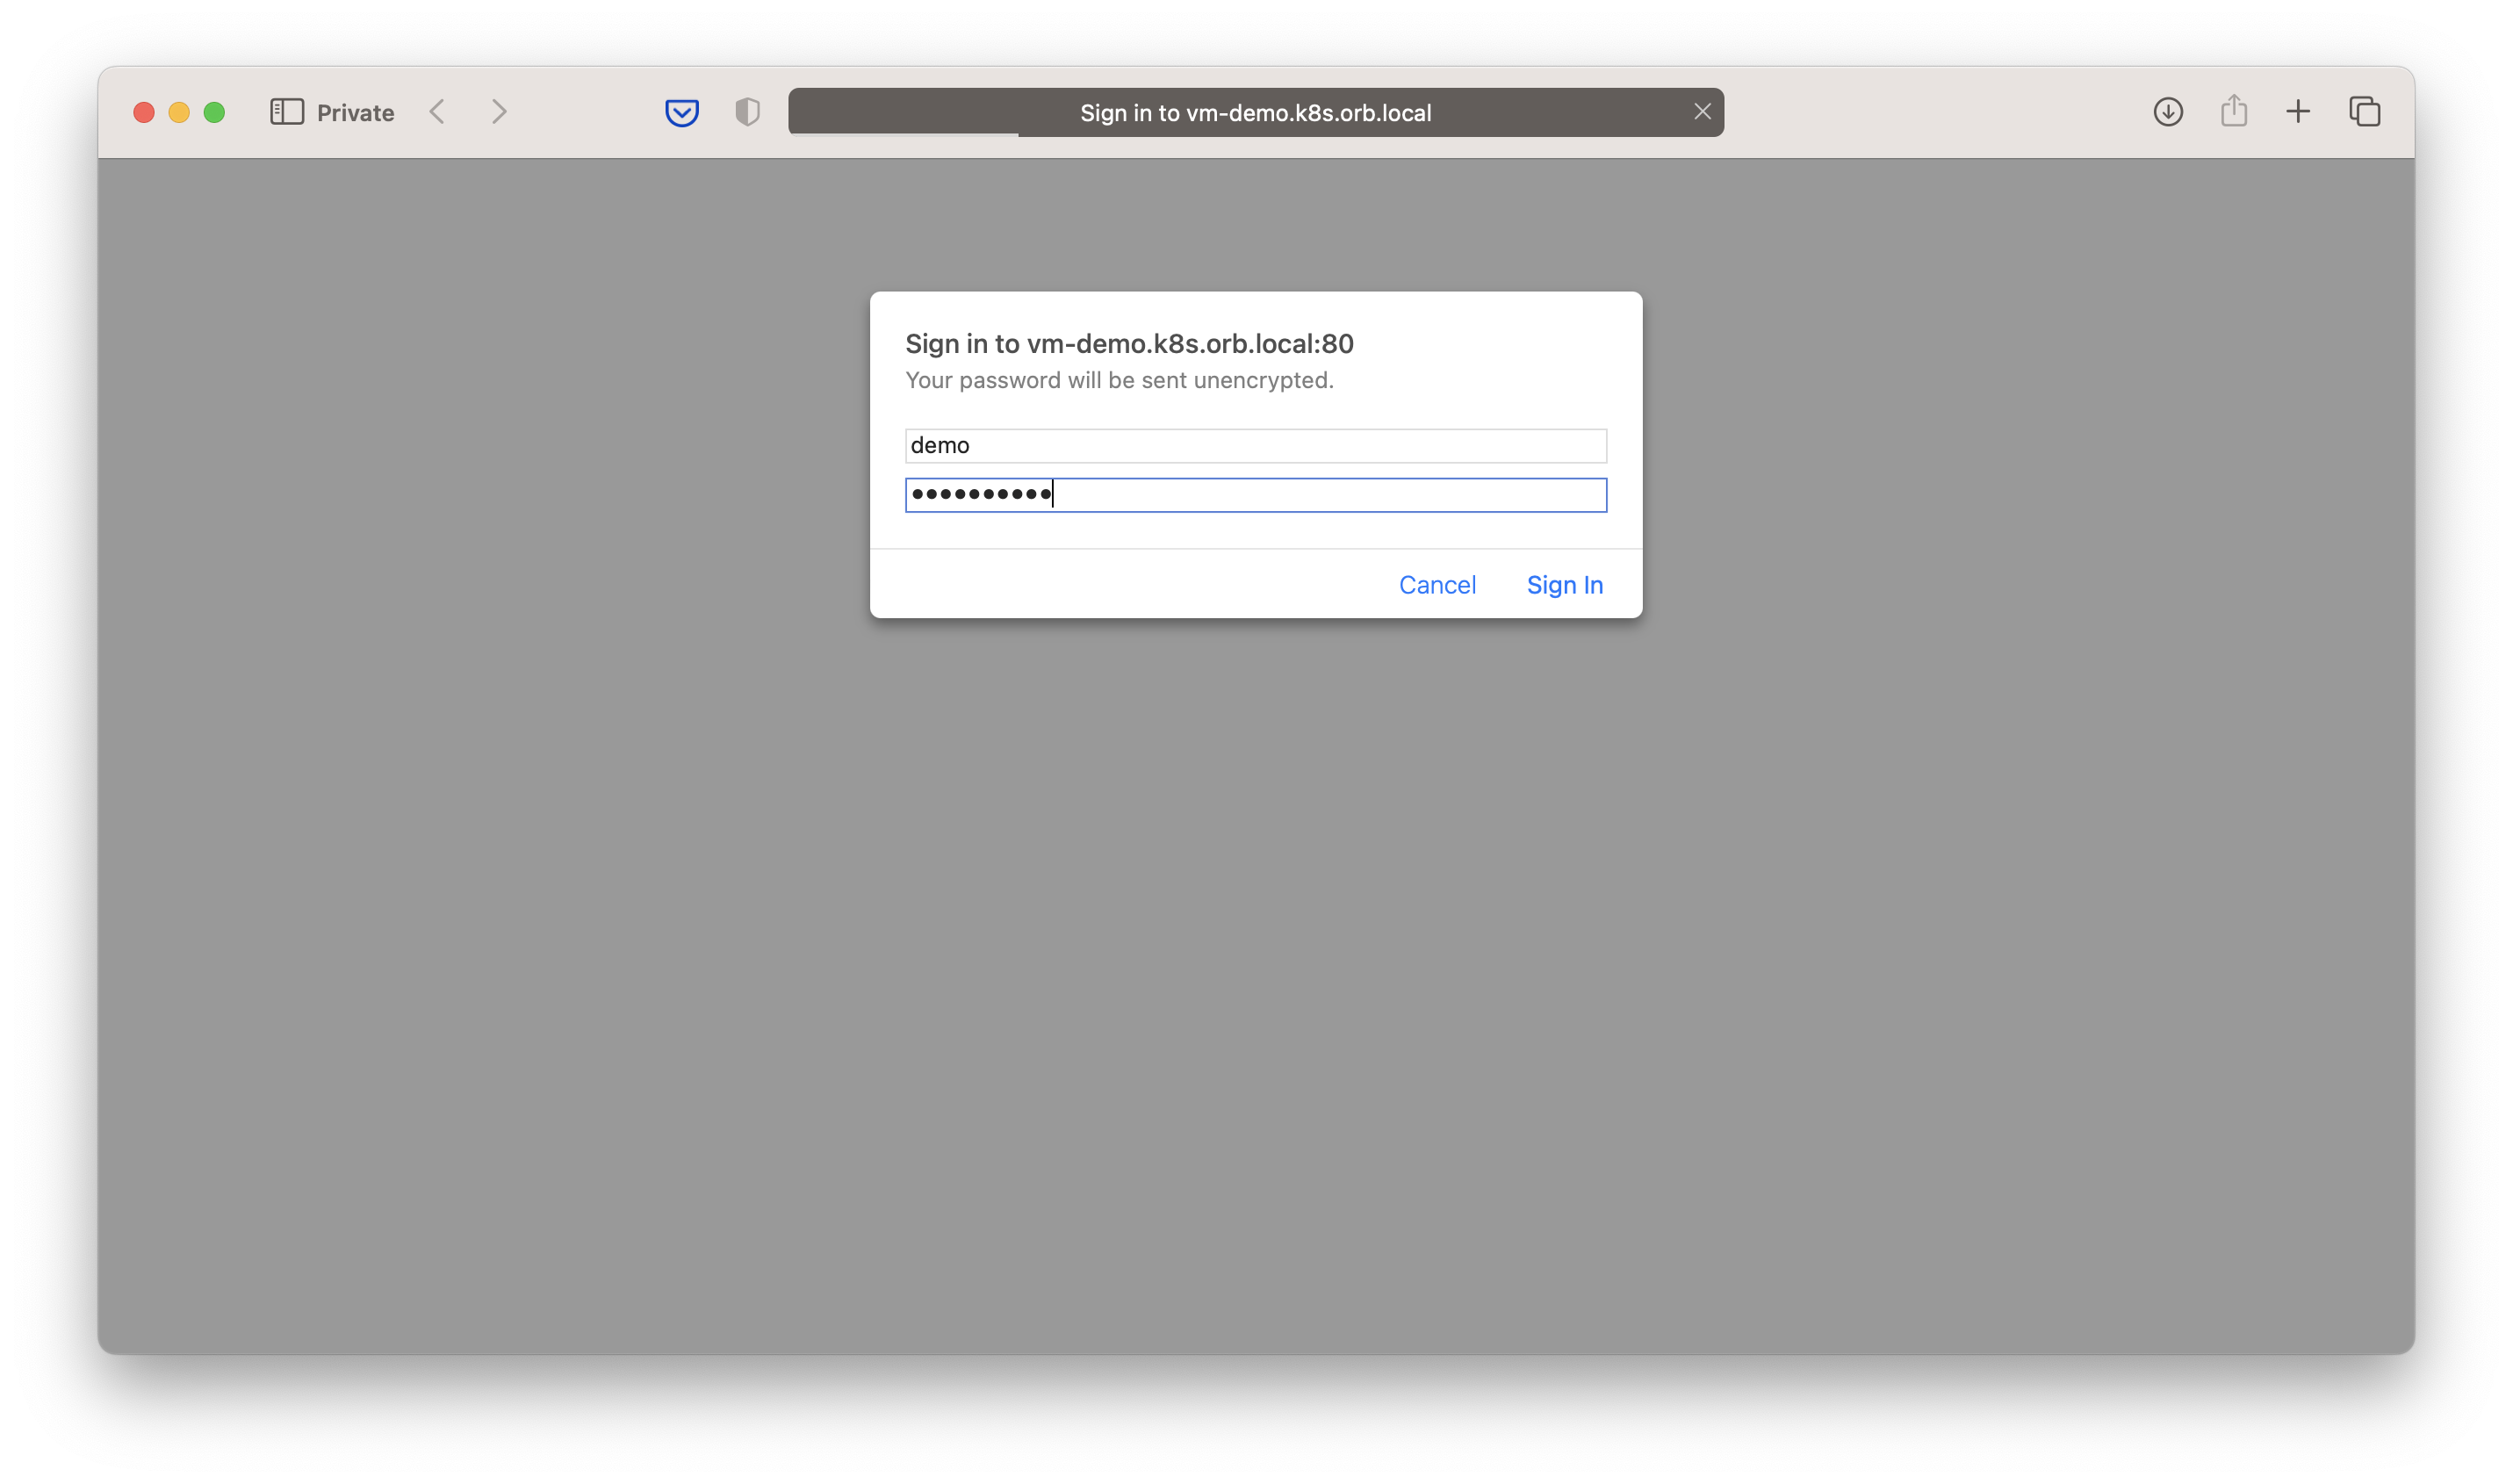
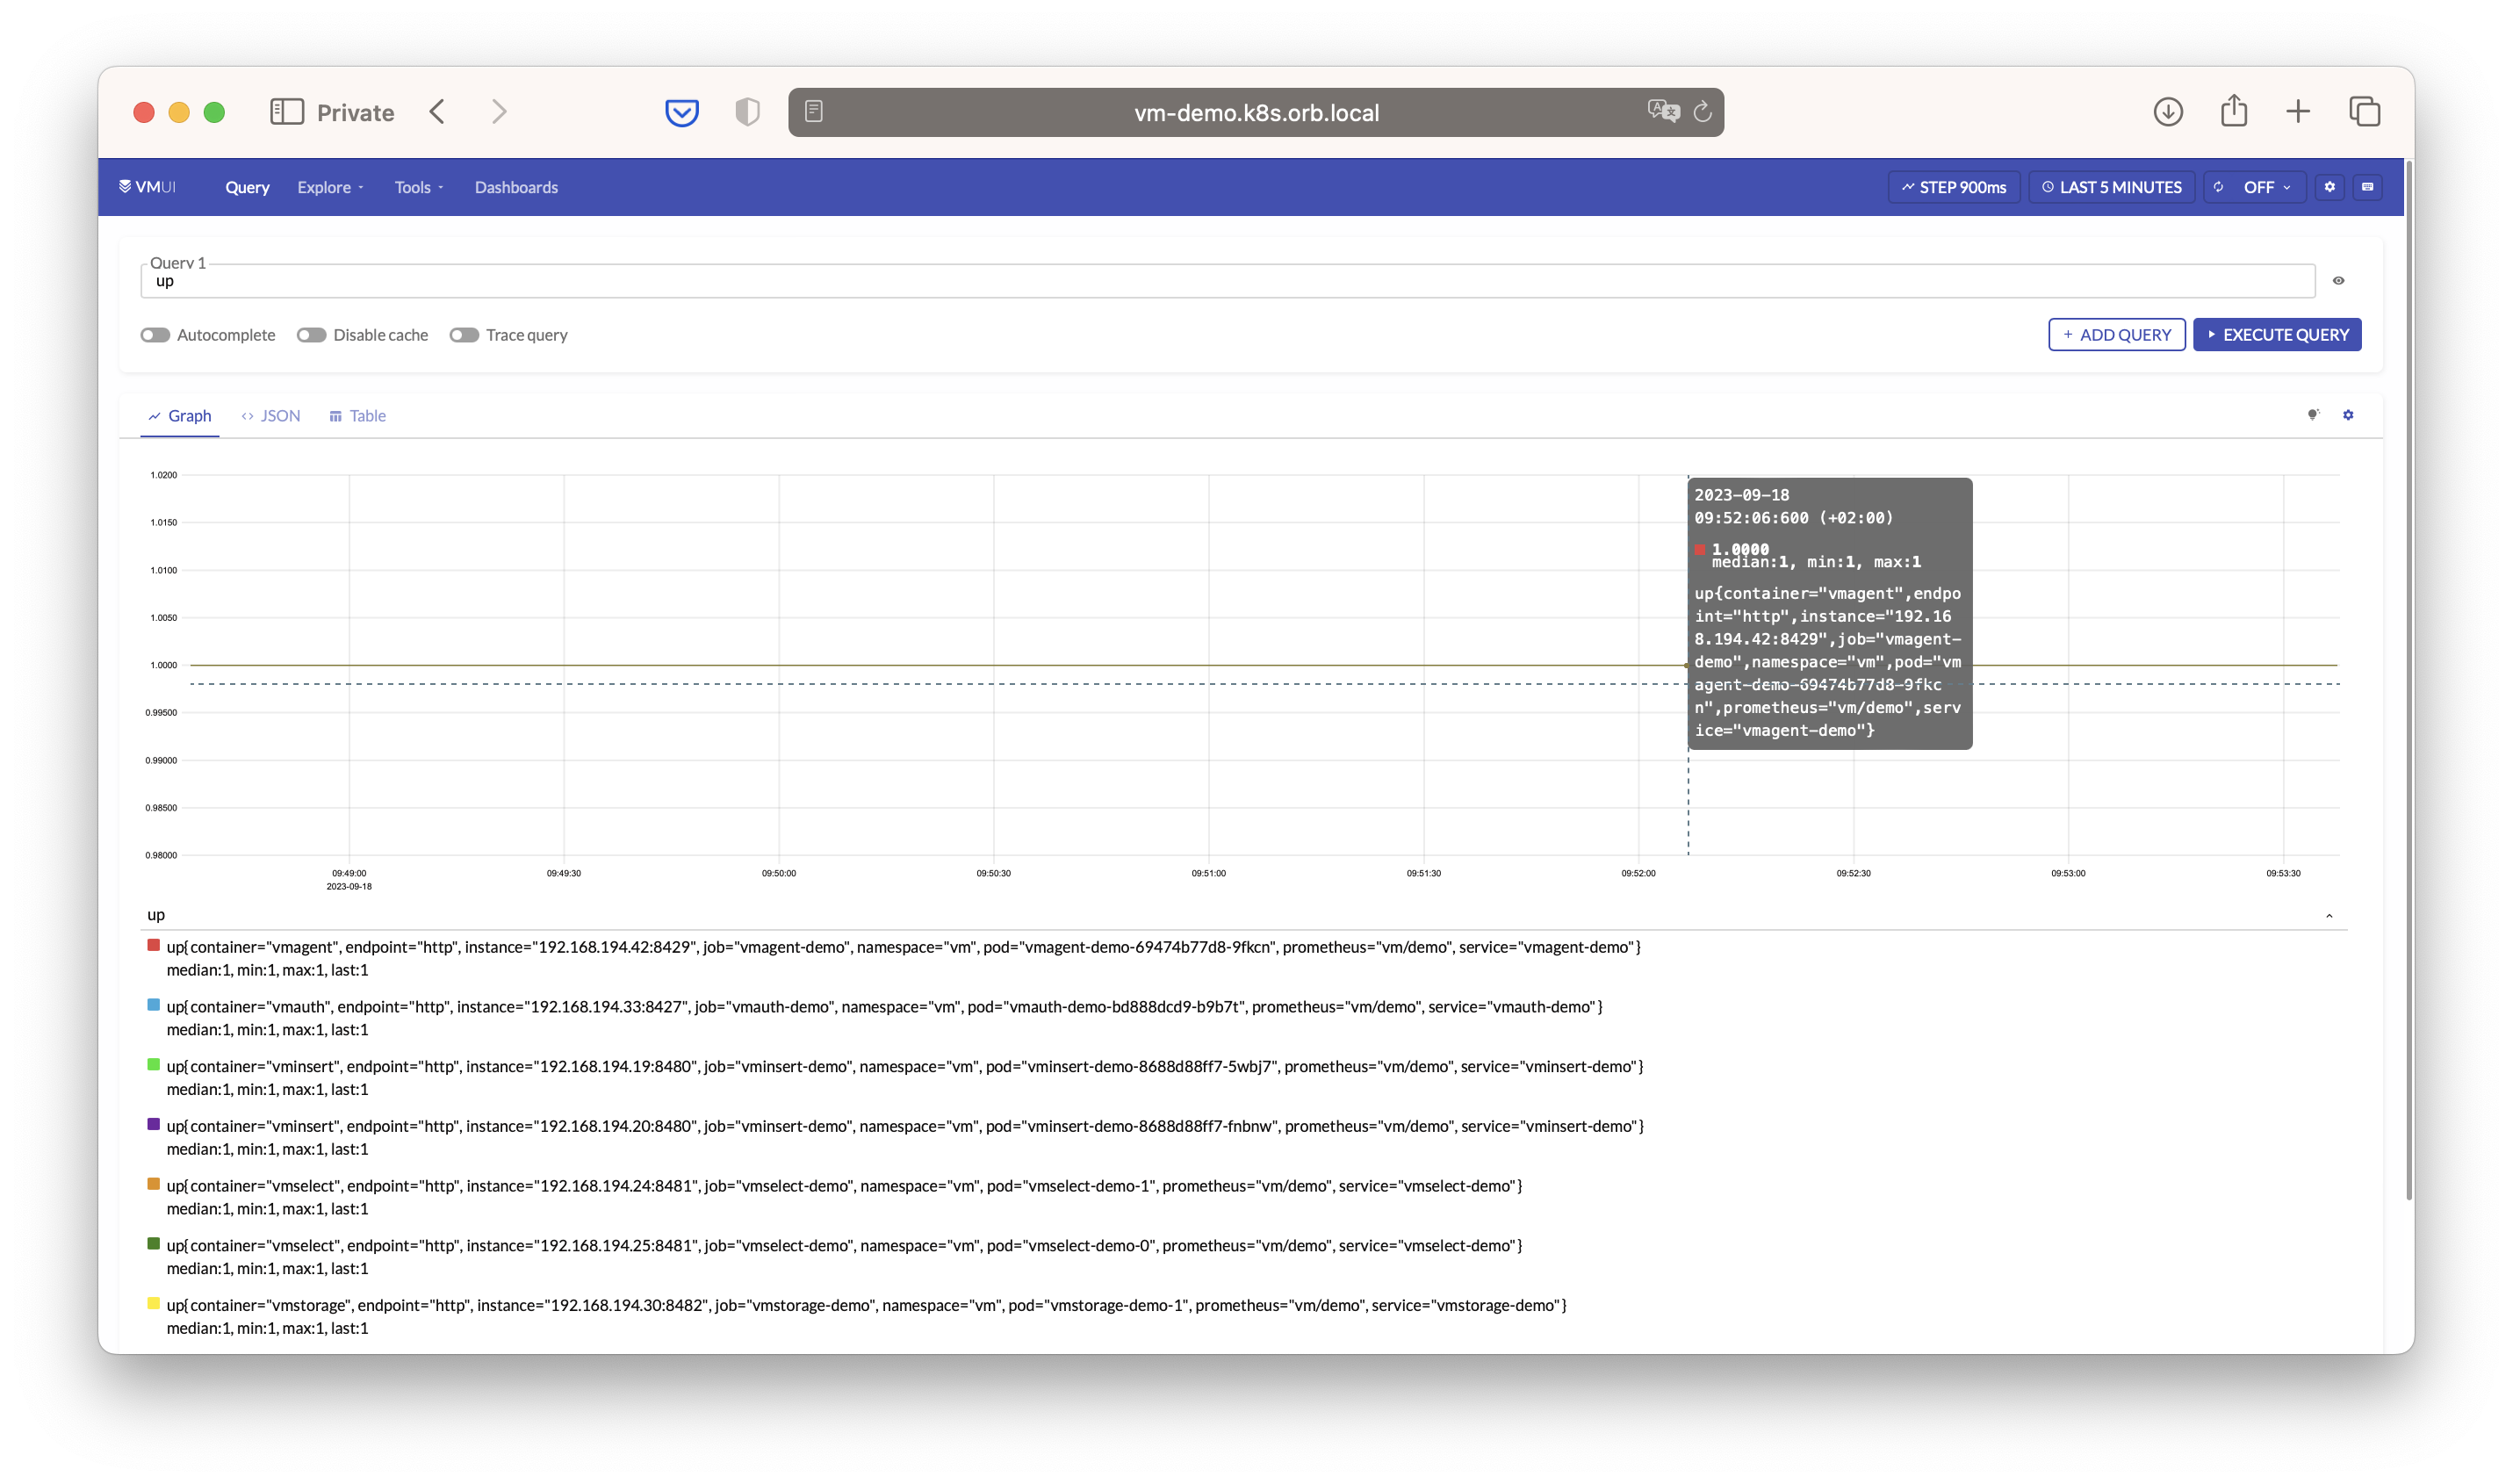
Now you can get access to your data with url http://vm-demo.k8s.orb.local/vmui, username demo
and your given password (Yt3N2r3cPl in our case):
Alerting
The remaining components will be needed for alerting.
VMAlertmanager
Let's start with vmalertmanager.
Create file vmuser.yaml
code vmuser.yaml
with the following content:
apiVersion: operator.victoriametrics.com/v1beta1
kind: VMAlertmanager
metadata:
  name: demo
spec:
  configRawYaml: |
    global:
      resolve_timeout: 5m
    route:
      group_wait: 30s
      group_interval: 5m
      repeat_interval: 12h
      receiver: 'webhook'
    receivers:
    - name: 'webhook'
      webhook_configs:
      - url: 'http://your-webhook-url'
where webhook-url is the address of the webhook to receive notifications
(configuration of AlertManager notifications will remain out of scope).
You can find more details about alertmanager configuration in
the Alertmanager documentation.
After that you can deploy vmalertmanager resource to the kubernetes cluster:
kubectl apply -f vmalertmanager.yaml -n vm

# vmalertmanager.operator.victoriametrics.com/demo created
Check that vmalertmanager is running:
kubectl get pods -n vm -l "app.kubernetes.io/instance=demo" -l "app.kubernetes.io/name=vmalertmanager"

# NAME                    READY   STATUS    RESTARTS   AGE
# vmalertmanager-demo-0   2/2     Running   0          107s
VMAlert
And now you can create vmalert resource.
Create file vmalert.yaml
code vmalert.yaml
with the following content:
apiVersion: operator.victoriametrics.com/v1beta1
kind: VMAlert
metadata:
  name: demo
spec:
  datasource:
    url: "http://vmselect-demo.vm.svc:8481/select/0/prometheus"
  remoteWrite:
    url: "http://vminsert-demo.vm.svc:8480/insert/0/prometheus"
  remoteRead:
    url: "http://vmselect-demo.vm.svc:8481/select/0/prometheus"
  notifier:
    url: "http://vmalertmanager-demo.vm.svc:9093"
  evaluationInterval: "30s"
  selectAllByDefault: true
  # for accessing to vmalert via vmauth with path prefix
  extraArgs:
    http.pathPrefix: /vmalert
After that you can deploy vmalert resource to the kubernetes cluster:
kubectl apply -f vmalert.yaml -n vm

# vmalert.operator.victoriametrics.com/demo created
Check that vmalert is running:
kubectl get pods -n vm -l "app.kubernetes.io/instance=demo" -l "app.kubernetes.io/name=vmalert"

# NAME                           READY   STATUS    RESTARTS   AGE
# vmalert-demo-bf75c67cb-hh4qd   2/2     Running   0          5s
VMRule
Now you can create vmrule resource for vmalert.
Create file vmrule.yaml
code vmrule.yaml
with the following content:
apiVersion: operator.victoriametrics.com/v1beta1
kind: VMRule
metadata:
  name: demo
spec:
  groups:
    - name: vmalert
      rules:
        - alert: vmalert config reload error
          expr: delta(vmalert_config_last_reload_errors_total[5m]) > 0
          for: 10s
          labels:
            severity: major
            job:  "{{ $labels.job }}"
          annotations:
            value: "{{ $value }}"
            description: 'error reloading vmalert config, reload count for 5 min {{ $value }}'
After that you can deploy vmrule resource to the kubernetes cluster:
kubectl apply -f vmrule.yaml -n vm

# vmrule.operator.victoriametrics.com/demo created
VMUser update
Let's update our user with access to vmalert and vmalertmanager:
code vmuser.yaml
apiVersion: operator.victoriametrics.com/v1beta1
kind: VMUser
metadata:
  name: demo
spec:
  name: demo
  username: demo
  generatePassword: true
  targetRefs:
    # vmui + vmselect
    - crd:
        kind: VMCluster/vmselect
        name: demo
        namespace: vm
      target_path_suffix: "/select/0"
      paths:
        - "/vmui"
        - "/vmui/.*"
        - "/prometheus/api/v1/query"
        - "/prometheus/api/v1/query_range"
        - "/prometheus/api/v1/series"
        - "/prometheus/api/v1/label/"
        - "/prometheus/api/v1/label/[^/]+/values"
    # vmalert
    - crd:
        kind: VMAlert
        name: demo
        namespace: vm
      paths:
        - "/vmalert"
        - "/vmalert/.*"
        - "/api/v1/groups"
        - "/api/v1/alert"
        - "/api/v1/alerts"
After that you can deploy vmuser resource to the kubernetes cluster:
kubectl apply -f vmuser.yaml -n vm

# vmuser.operator.victoriametrics.com/demo created
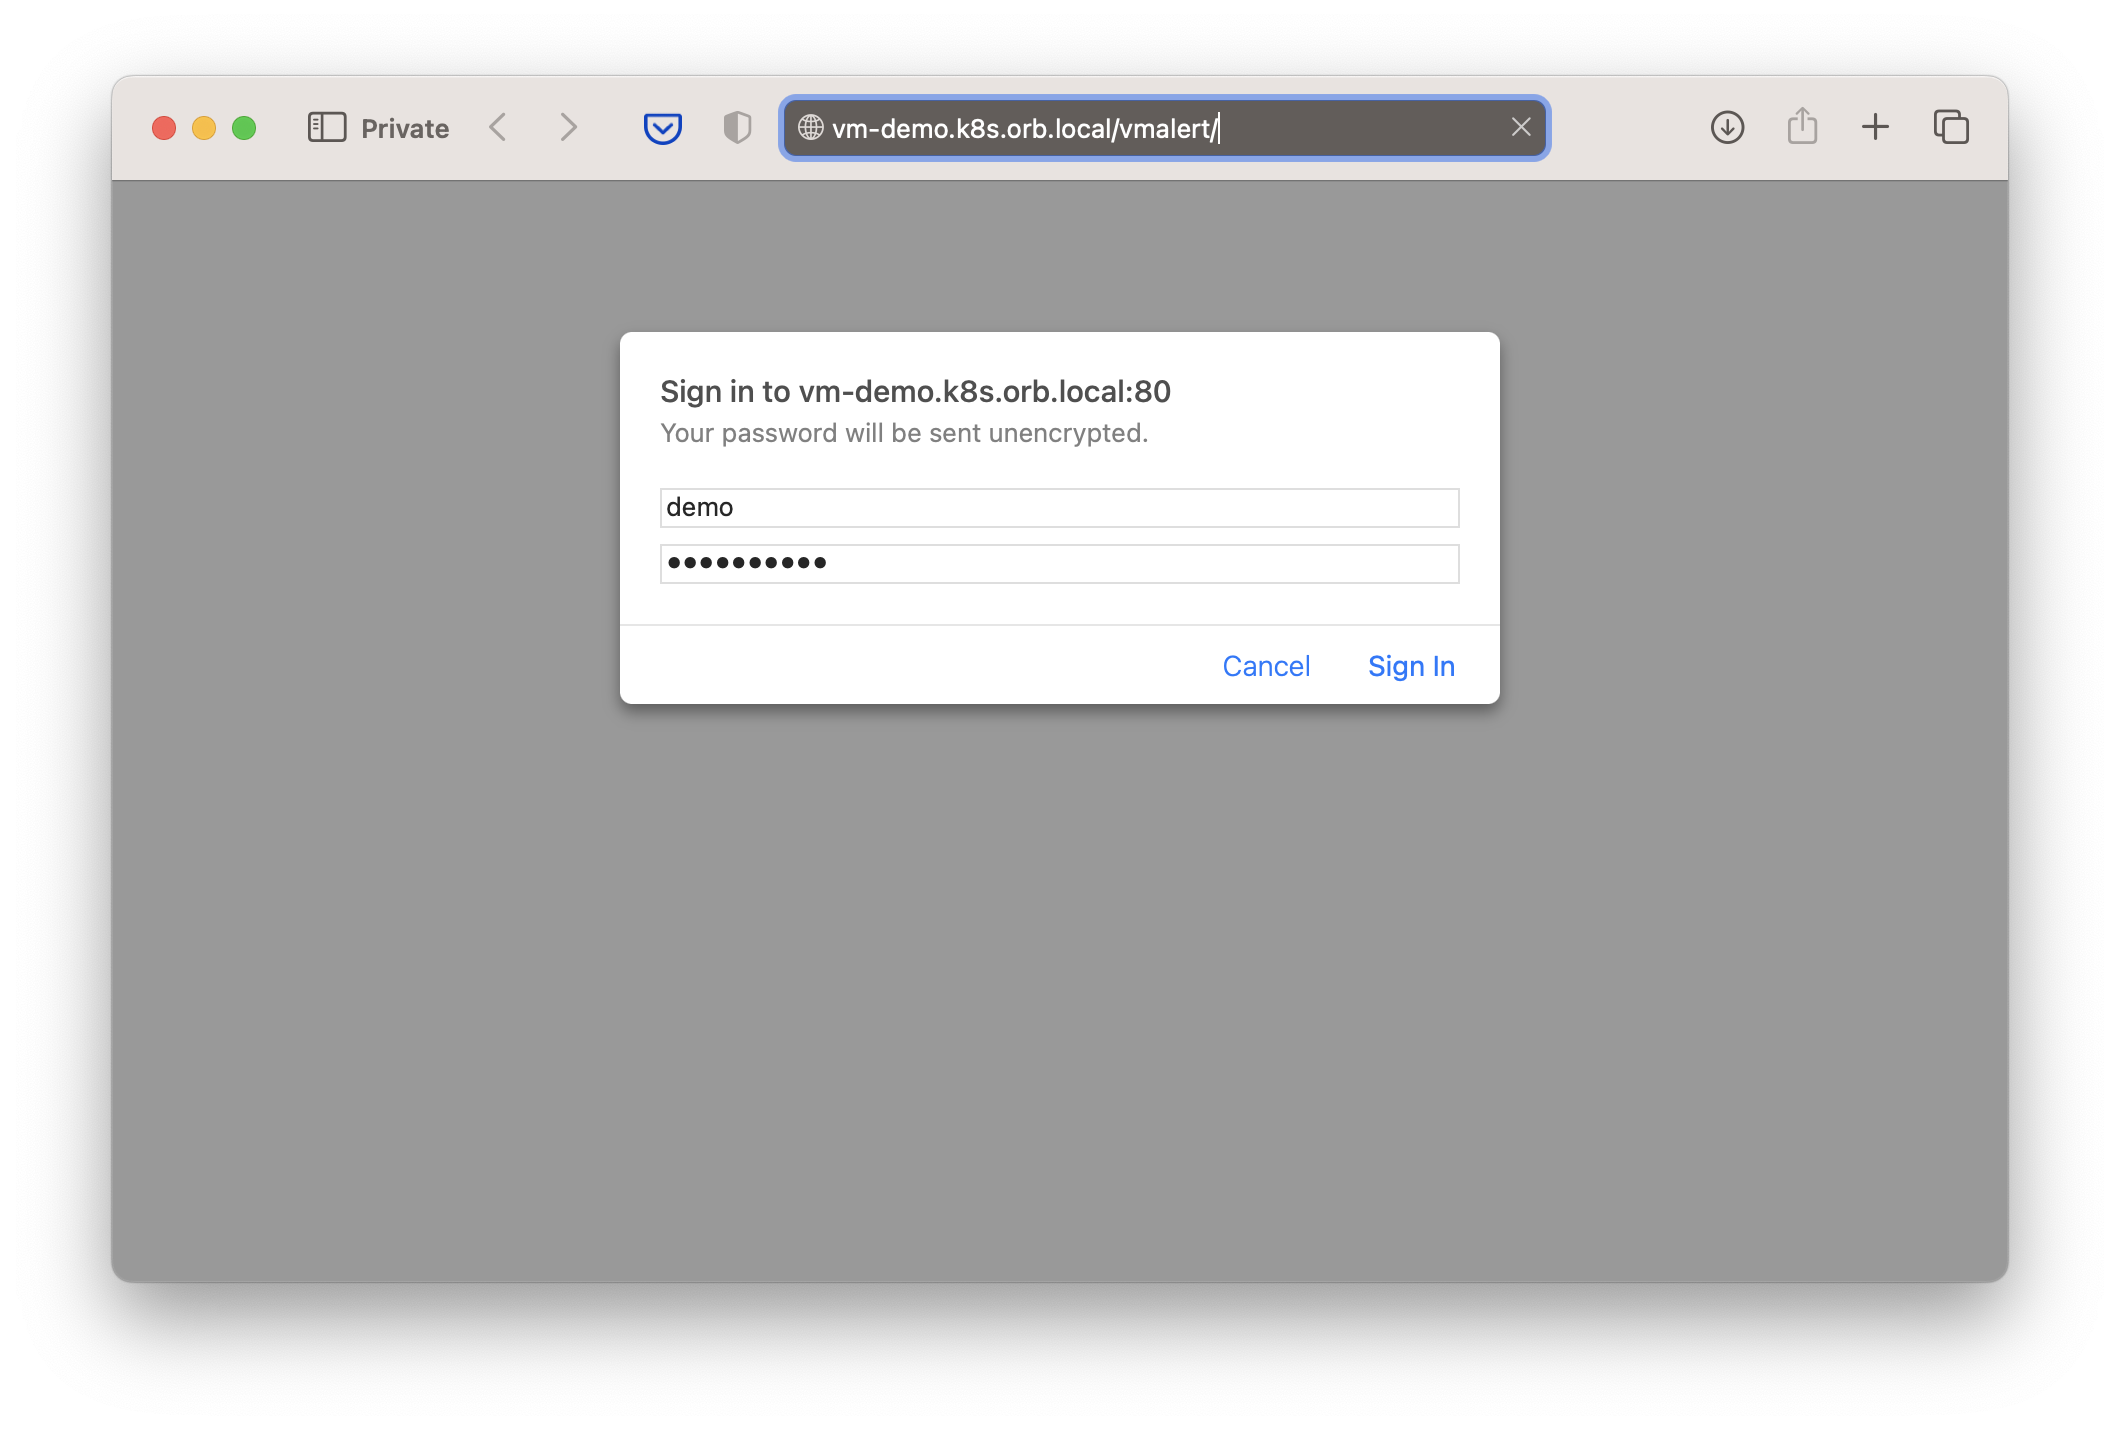
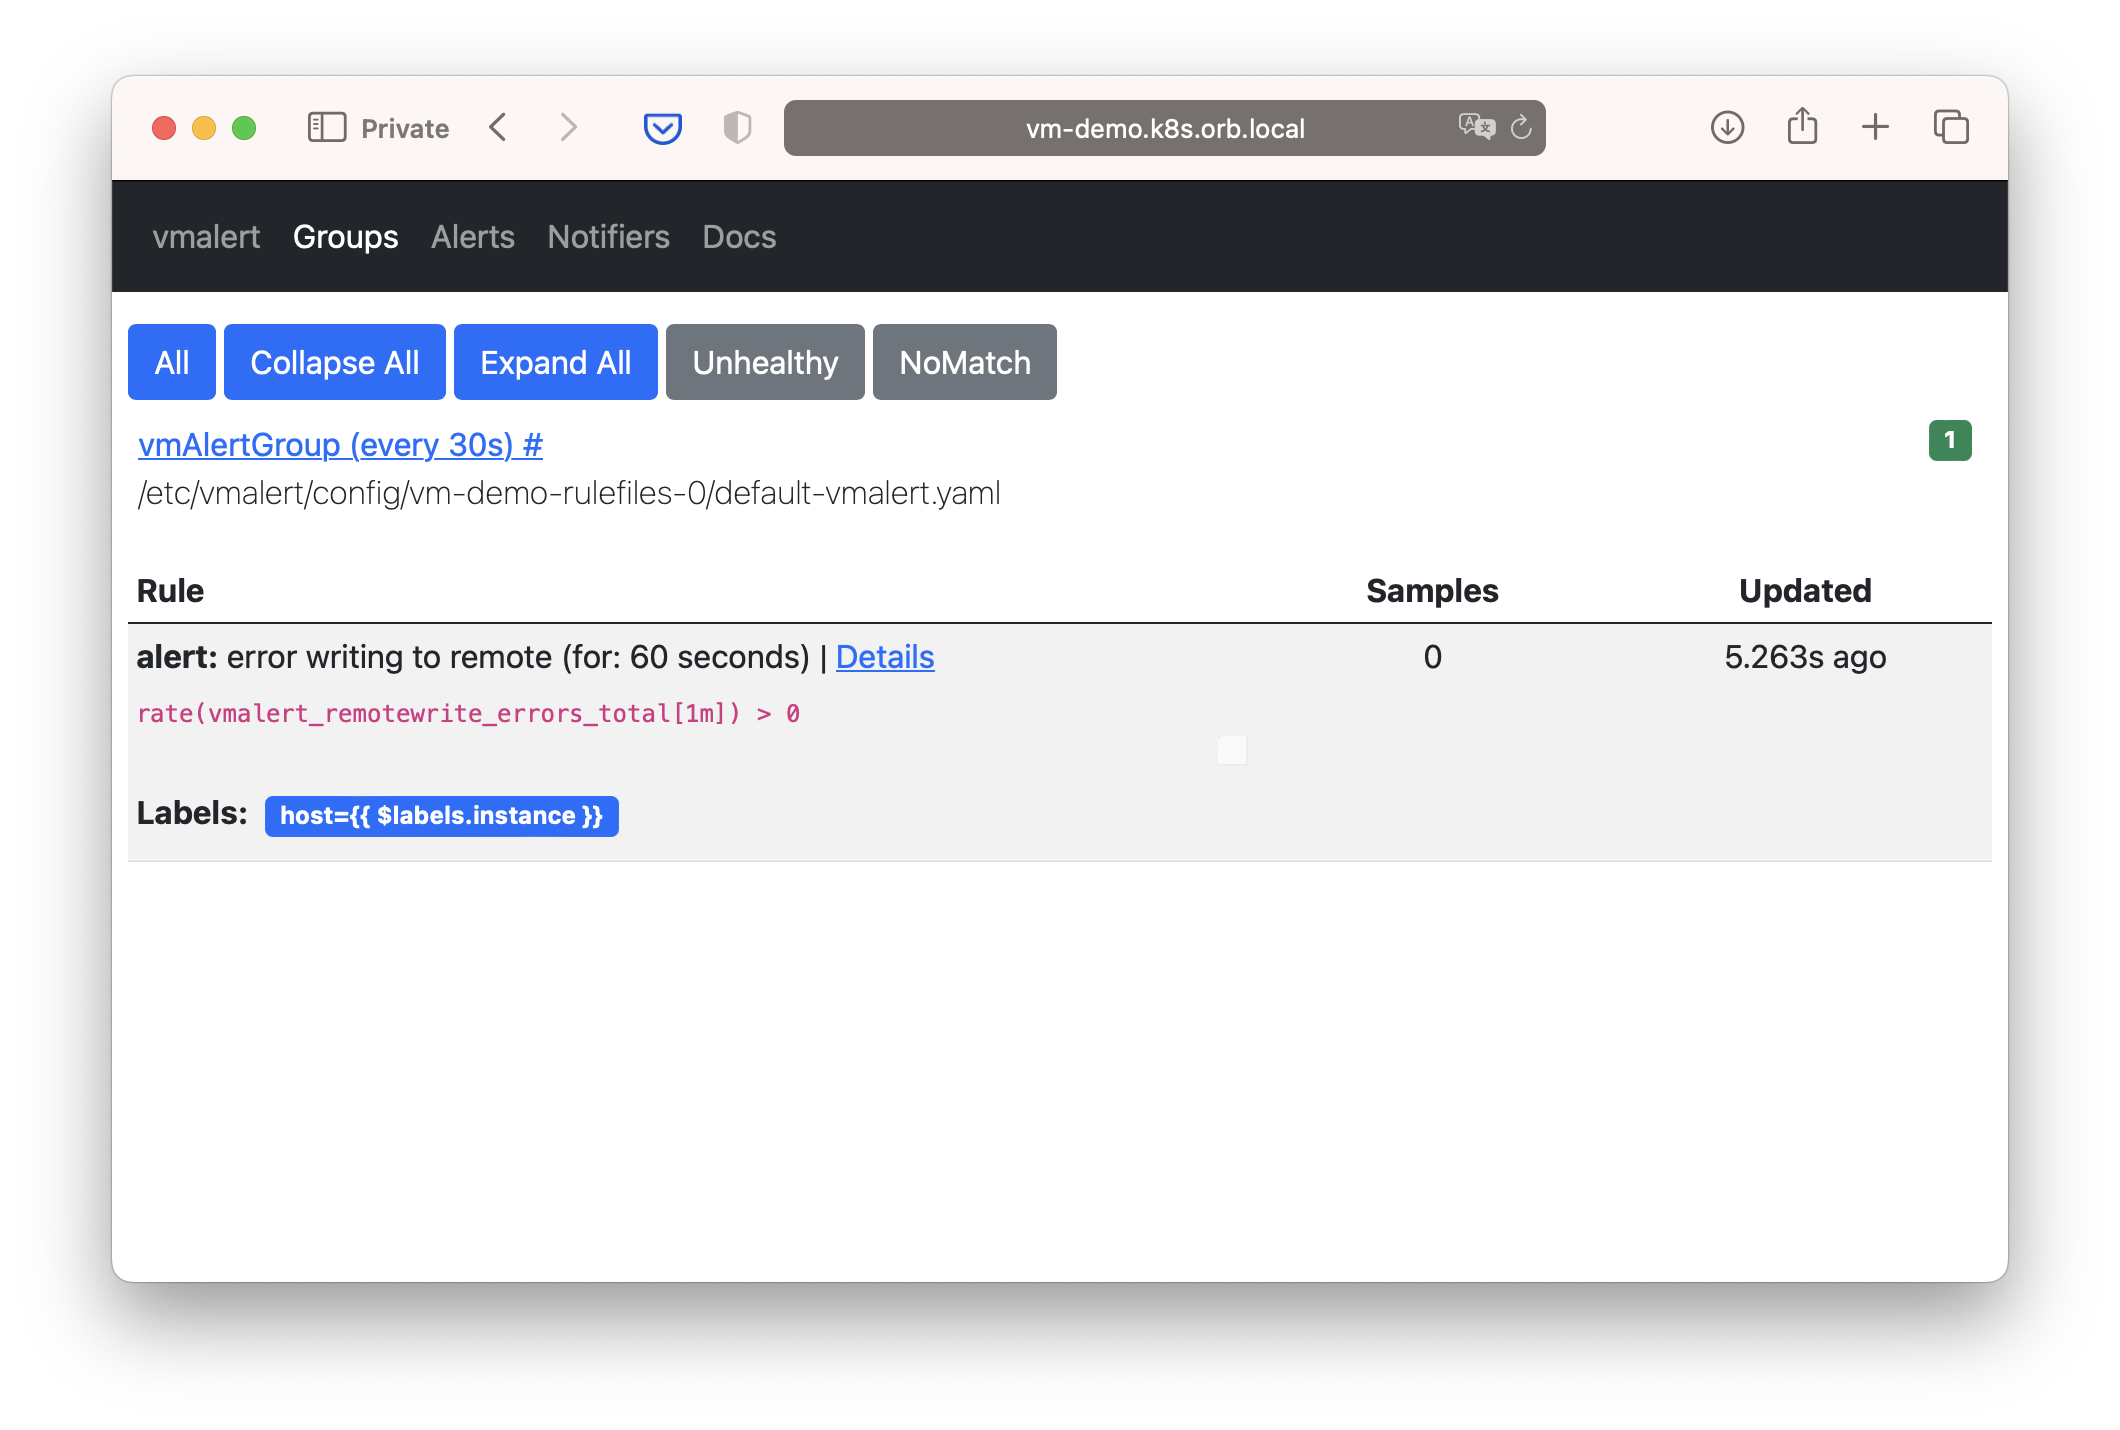
And now you can get access to your data with url http://vm-demo.k8s.orb.local/vmalert
(for your environment it most likely will be different) with username demo:
Anything else
That's it. We obtained a monitoring cluster corresponding to the target topology:

You have a full-stack monitoring cluster with VictoriaMetrics Operator.
You can find information about these and other resources of operator on the Custom resources page.
In addition, check out other sections of the documentation for VictoriaMetrics Operator:
- Setup
- Security
- Configuration
- Migration from Prometheus
- Monitoring
- Authorization and exposing components
- High Availability
- Enterprise
If you have any questions, check out our FAQ and feel free to can ask them:
If you have any suggestions or find a bug, please create an issue on GitHub.