50 KiB
| sort | weight | title | menu | aliases | |||||||
|---|---|---|---|---|---|---|---|---|---|---|---|
| 98 | 98 | Streaming aggregation |
|
|
Streaming aggregation
vmagent and single-node VictoriaMetrics can aggregate incoming samples in streaming mode by time and by labels before data is written to remote storage (or local storage for single-node VictoriaMetrics). The aggregation is applied to all the metrics received via any supported data ingestion protocol and/or scraped from Prometheus-compatible targets after applying all the configured relabeling stages.
By default stream aggregation ignores timestamps associated with the input samples. It expects that the ingested samples have timestamps close to the current time. See how to ignore old samples.
Stream aggregation can be configured via the following command-line flags:
-remoteWrite.streamAggr.configat vmagent. This flag can be specified individually per each-remoteWrite.url. This allows writing different aggregates to different remote storage destinations.-streamAggr.configat single-node VictoriaMetrics.
These flags must point to a file containing stream aggregation config.
The file may contain %{ENV_VAR} placeholders which are substituted by the corresponding ENV_VAR environment variable values.
By default, the following data is written to the storage when stream aggregation is enabled:
- the aggregated samples;
- the raw input samples, which didn't match any
matchoption in the provided config.
This behaviour can be changed via the following command-line flags:
-remoteWrite.streamAggr.keepInputat vmagent and-streamAggr.keepInputat single-node VictoriaMetrics. If one of these flags is set, then all the input samples are written to the storage alongside the aggregated samples. The-remoteWrite.streamAggr.keepInputflag can be specified individually per each-remoteWrite.url.-remoteWrite.streamAggr.dropInputat vmagent and-streamAggr.dropInputat single-node VictoriaMetrics. If one of these flags are set, then all the input samples are dropped, while only the aggregated samples are written to the storage. The-remoteWrite.streamAggr.dropInputflag can be specified individually per each-remoteWrite.url.
Deduplication
vmagent supports online de-duplication of samples
before sending them to the configured -remoteWrite.url. The de-duplication can be enabled via the following options:
-
By specifying the desired de-duplication interval via
-remoteWrite.streamAggr.dedupIntervalcommand-line flag for the particular-remoteWrite.url. For example,./vmagent -remoteWrite.url=http://remote-storage/api/v1/write -remoteWrite.streamAggr.dedupInterval=30sinstructsvmagentto leave only the last sample per each seen time series per every 30 seconds. The de-duplication is performed after applying-remoteWrite.relabelConfigand-remoteWrite.urlRelabelConfigrelabeling.If the
-remoteWrite.streamAggr.configis set, then the de-duplication is performed individually per each stream aggregation config for the matching samples after applying input_relabel_configs. -
By specifying
dedup_intervaloption individually per each stream aggregation config at-remoteWrite.streamAggr.config.
Single-node VictoriaMetrics supports two types of de-duplication:
- After storing the duplicate samples to local storage. See
-dedup.minScrapeIntervalcommand-line option. - Before storing the duplicate samples to local storage. This type of de-duplication can be enabled via the following options:
-
By specifying the desired de-duplication interval via
-streamAggr.dedupIntervalcommand-line flag. For example,./victoria-metrics -streamAggr.dedupInterval=30sinstructs VictoriaMetrics to leave only the last sample per each seen time series per every 30 seconds. The de-duplication is performed after applying-relabelConfigrelabeling.If the
-streamAggr.configis set, then the de-duplication is performed individually per each stream aggregation config for the matching samples after applying input_relabel_configs. -
By specifying
dedup_intervaloption individually per each stream aggregation config at-streamAggr.config.
-
It is possible to drop the given labels before applying the de-duplication. See these docs.
The online de-duplication uses the same logic as -dedup.minScrapeInterval command-line flag at VictoriaMetrics.
Ignoring old samples
By default all the input samples are taken into account during stream aggregation. If samples with old timestamps outside the current aggregation interval must be ignored, then the following options can be used:
-
To pass
-remoteWrite.streamAggr.ignoreOldSamplescommand-line flag to vmagent or-streamAggr.ignoreOldSamplescommand-line flag to single-node VictoriaMetrics. This enables ignoring old samples for all the aggregation configs. -
To set
ignore_old_samples: trueoption at the particular aggregation config. This enables ignoring old samples for that particular aggregation config.
Flush time alignment
By default the time for aggregated data flush is aligned by the interval option specified in aggregate config.
For example:
- if
interval: 1mis set, then the aggregated data is flushed to the storage at the end of every minute - if
interval: 1his set, then the aggregated data is flushed to the storage at the end of every hour
If you do not need such an alignment, then set no_align_flush_to_interval: true option in the aggregate config.
In this case aggregated data flushes will be aligned to the vmagent start time or to config reload time.
The aggregated data on the first and the last interval is dropped during vmagent start, restart or config reload,
since the first and the last aggregation intervals are incomplete, so they usually contain incomplete confusing data.
If you need preserving the aggregated data on these intervals, then set flush_on_shutdown: true option in the aggregate config.
Use cases
Stream aggregation can be used in the following cases:
- Statsd alternative
- Recording rules alternative
- Reducing the number of stored samples
- Reducing the number of stored series
Statsd alternative
Stream aggregation can be used as statsd alternative in the following cases:
- Counting input samples
- Summing input metrics
- Quantiles over input metrics
- Histograms over input metrics
- Aggregating histograms
Currently, streaming aggregation is available only for supported data ingestion protocols and not available for Statsd metrics format.
Recording rules alternative
Sometimes alerting queries may require non-trivial amounts of CPU, RAM,
disk IO and network bandwidth at metrics storage side. For example, if http_request_duration_seconds histogram is generated by thousands
of application instances, then the alerting query histogram_quantile(0.99, sum(increase(http_request_duration_seconds_bucket[5m])) without (instance)) > 0.5
can become slow, since it needs to scan too big number of unique time series
with http_request_duration_seconds_bucket name. This alerting query can be accelerated by pre-calculating
the sum(increase(http_request_duration_seconds_bucket[5m])) without (instance) via recording rule.
But this recording rule may take too much time to execute too. In this case the slow recording rule can be substituted
with the following stream aggregation config:
- match: 'http_request_duration_seconds_bucket'
  interval: 5m
  without: [instance]
  outputs: [total]
This stream aggregation generates http_request_duration_seconds_bucket:5m_without_instance_total output series according to output metric naming.
Then these series can be used in alerting rules:
histogram_quantile(0.99, last_over_time(http_request_duration_seconds_bucket:5m_without_instance_total[5m])) > 0.5
This query is executed much faster than the original query, because it needs to scan much lower number of time series.
See the list of aggregate output, which can be specified at output field.
See also aggregating by labels.
Field interval is recommended to be set to a value at least several times higher than your metrics collect interval.
Reducing the number of stored samples
If per-series samples are ingested at high frequency, then this may result in high disk space usage, since too much data must be stored to disk. This also may result in slow queries, since too much data must be processed during queries.
This can be fixed with the stream aggregation by increasing the interval between per-series samples stored in the database.
For example, the following stream aggregation config reduces the frequency of input samples to one sample per 5 minutes per each input time series (this operation is also known as downsampling):
  # Aggregate metrics ending with _total with `total` output.
  # See https://docs.victoriametrics.com/stream-aggregation/#aggregation-outputs
- match: '{__name__=~".+_total"}'
  interval: 5m
  outputs: [total]

  # Downsample other metrics with `count_samples`, `sum_samples`, `min` and `max` outputs
  # See https://docs.victoriametrics.com/stream-aggregation/#aggregation-outputs
- match: '{__name__!~".+_total"}'
  interval: 5m
  outputs: [count_samples, sum_samples, min, max]
The aggregated output metrics have the following names according to output metric naming:
# For input metrics ending with _total
some_metric_total:5m_total

# For input metrics not ending with _total
some_metric:5m_count_samples
some_metric:5m_sum_samples
some_metric:5m_min
some_metric:5m_max
See the list of aggregate output, which can be specified at output field.
See also aggregating histograms and aggregating by labels.
Reducing the number of stored series
Sometimes applications may generate too many time series.
For example, the http_requests_total metric may have path or user label with too big number of unique values.
In this case the following stream aggregation can be used for reducing the number metrics stored in VictoriaMetrics:
- match: 'http_requests_total'
  interval: 30s
  without: [path, user]
  outputs: [total]
This config specifies labels, which must be removed from the aggregate output, in the without list.
See these docs for more details.
The aggregated output metric has the following name according to output metric naming:
http_requests_total:30s_without_path_user_total
See the list of aggregate output, which can be specified at output field.
See also aggregating histograms.
Counting input samples
If the monitored application generates event-based metrics, then it may be useful to count the number of such metrics at stream aggregation level.
For example, if an advertising server generates hits{some="labels"} 1 and clicks{some="labels"} 1 metrics
per each incoming hit and click, then the following stream aggregation config
can be used for counting these metrics per every 30 second interval:
- match: '{__name__=~"hits|clicks"}'
  interval: 30s
  outputs: [count_samples]
This config generates the following output metrics for hits and clicks input metrics
according to output metric naming:
hits:30s_count_samples count1
clicks:30s_count_samples count2
See the list of aggregate output, which can be specified at output field.
See also aggregating by labels.
Summing input metrics
If the monitored application calculates some events and then sends the calculated number of events to VictoriaMetrics at irregular intervals or at too high frequency, then stream aggregation can be used for summing such events and writing the aggregate sums to the storage at regular intervals.
For example, if an advertising server generates hits{some="labels} N and clicks{some="labels"} M metrics
at irregular intervals, then the following stream aggregation config
can be used for summing these metrics per every minute:
- match: '{__name__=~"hits|clicks"}'
  interval: 1m
  outputs: [sum_samples]
This config generates the following output metrics according to output metric naming:
hits:1m_sum_samples sum1
clicks:1m_sum_samples sum2
See the list of aggregate output, which can be specified at output field.
See also aggregating by labels.
Quantiles over input metrics
If the monitored application generates measurement metrics per each request, then it may be useful to calculate the pre-defined set of percentiles over these measurements.
For example, if the monitored application generates request_duration_seconds N and response_size_bytes M metrics
per each incoming request, then the following stream aggregation config
can be used for calculating 50th and 99th percentiles for these metrics every 30 seconds:
- match:
  - request_duration_seconds
  - response_size_bytes
  interval: 30s
  outputs: ["quantiles(0.50, 0.99)"]
This config generates the following output metrics according to output metric naming:
request_duration_seconds:30s_quantiles{quantile="0.50"} value1
request_duration_seconds:30s_quantiles{quantile="0.99"} value2

response_size_bytes:30s_quantiles{quantile="0.50"} value1
response_size_bytes:30s_quantiles{quantile="0.99"} value2
See the list of aggregate output, which can be specified at output field.
See also histograms over input metrics and aggregating by labels.
Histograms over input metrics
If the monitored application generates measurement metrics per each request, then it may be useful to calculate a histogram over these metrics.
For example, if the monitored application generates request_duration_seconds N and response_size_bytes M metrics
per each incoming request, then the following stream aggregation config
can be used for calculating VictoriaMetrics histogram buckets
for these metrics every 60 seconds:
- match:
  - request_duration_seconds
  - response_size_bytes
  interval: 60s
  outputs: [histogram_bucket]
This config generates the following output metrics according to output metric naming.
request_duration_seconds:60s_histogram_bucket{vmrange="start1...end1"} count1
request_duration_seconds:60s_histogram_bucket{vmrange="start2...end2"} count2
...
request_duration_seconds:60s_histogram_bucket{vmrange="startN...endN"} countN

response_size_bytes:60s_histogram_bucket{vmrange="start1...end1"} count1
response_size_bytes:60s_histogram_bucket{vmrange="start2...end2"} count2
...
response_size_bytes:60s_histogram_bucket{vmrange="startN...endN"} countN
The resulting histogram buckets can be queried with MetricsQL in the following ways:
-
An estimated 50th and 99th percentiles of the request duration over the last hour:
histogram_quantiles("quantile", 0.50, 0.99, sum(increase(request_duration_seconds:60s_histogram_bucket[1h])) by (vmrange))This query uses histogram_quantiles function.
-
An estimated standard deviation of the request duration over the last hour:
histogram_stddev(sum(increase(request_duration_seconds:60s_histogram_bucket[1h])) by (vmrange))This query uses histogram_stddev function.
-
An estimated share of requests with the duration smaller than
0.5sover the last hour:histogram_share(0.5, sum(increase(request_duration_seconds:60s_histogram_bucket[1h])) by (vmrange))This query uses histogram_share function.
See the list of aggregate output, which can be specified at output field.
See also quantiles over input metrics and aggregating by labels.
Aggregating histograms
Histogram is a set of counter
metrics with different vmrange or le labels. As they're counters, the applicable aggregation output is
total:
- match: 'http_request_duration_seconds_bucket'
  interval: 1m
  without: [instance]
  outputs: [total]
This config generates the following output metrics according to output metric naming:
http_request_duration_seconds_bucket:1m_without_instance_total{le="0.1"} value1
http_request_duration_seconds_bucket:1m_without_instance_total{le="0.2"} value2
http_request_duration_seconds_bucket:1m_without_instance_total{le="0.4"} value3
http_request_duration_seconds_bucket:1m_without_instance_total{le="1"}   value4
http_request_duration_seconds_bucket:1m_without_instance_total{le="3"}   value5
http_request_duration_seconds_bucket:1m_without_instance_total{le="+Inf" value6
The resulting metrics can be passed to histogram_quantile function:
histogram_quantile(0.9, sum(rate(http_request_duration_seconds_bucket:1m_without_instance_total[5m])) by(le))
Please note, histograms can be aggregated if their le labels are configured identically.
VictoriaMetrics histogram buckets
have no such requirement.
See the list of aggregate output, which can be specified at output field.
See also histograms over input metrics and quantiles over input metrics.
Output metric names
Output metric names for stream aggregation are constructed according to the following pattern:
<metric_name>:<interval>[_by_<by_labels>][_without_<without_labels>]_<output>
<metric_name>is the original metric name.<interval>is the interval specified in the stream aggregation config.<by_labels>is_-delimited sorted list ofbylabels specified in the stream aggregation config. If thebylist is missing in the config, then the_by_<by_labels>part isn't included in the output metric name.<without_labels>is an optional_-delimited sorted list ofwithoutlabels specified in the stream aggregation config. If thewithoutlist is missing in the config, then the_without_<without_labels>part isn't included in the output metric name.<output>is the aggregate used for constructing the output metric. The aggregate name is taken from theoutputslist at the corresponding stream aggregation config.
Both input and output metric names can be modified if needed via relabeling according to these docs.
It is possible to leave the original metric name after the aggregation by specifying keep_metric_names: true option at stream aggregation config.
The keep_metric_names option can be used if only a single output is set in outputs list.
Relabeling
It is possible to apply arbitrary relabeling to input and output metrics
during stream aggregation via input_relabel_configs and output_relabel_configs options in stream aggregation config.
Relabeling rules inside input_relabel_configs are applied to samples matching the match filters before optional deduplication.
Relabeling rules inside output_relabel_configs are applied to aggregated samples before sending them to the remote storage.
For example, the following config removes the :1m_sum_samples suffix added to the output metric name:
- interval: 1m
  outputs: [sum_samples]
  output_relabel_configs:
  - source_labels: [__name__]
    target_label: __name__
    regex: "(.+):.+"
Another option to remove the suffix, which is added by stream aggregation, is to add keep_metric_names: true to the config:
- interval: 1m
  outputs: [sum_samples]
  keep_metric_names: true
See also dropping unneded labels.
Dropping unneeded labels
If you need dropping some labels from input samples before input relabeling, de-duplication and stream aggregation, then the following options exist:
-
To specify comma-separated list of label names to drop in
-streamAggr.dropInputLabelscommand-line flag. For example,-streamAggr.dropInputLabels=replica,azinstructs to dropreplicaandazlabels from input samples before applying de-duplication and stream aggregation. -
To specify
drop_input_labelslist with the labels to drop in stream aggregation config. For example, the following config dropsreplicalabel from input samples with the nameprocess_resident_memory_bytesbefore calculating the average over one minute:- match: process_resident_memory_bytes interval: 1m drop_input_labels: [replica] outputs: [avg] keep_metric_names: true
Typical use case is to drop replica label from samples, which are recevied from high availability replicas.
Aggregation outputs
The aggregations are calculated during the interval specified in the config
and then sent to the storage once per interval. The aggregated samples are named according to output metric naming.
If by and without lists are specified in the config,
then the aggregation by labels is performed additionally to aggregation by interval.
Below are aggregation functions that can be put in the outputs list at stream aggregation config:
- avg
- count_samples
- count_series
- increase
- increase_prometheus
- histogram_bucket
- last
- max
- min
- stddev
- stdvar
- sum_samples
- total
- total_prometheus
- unique_samples
- quantiles
avg
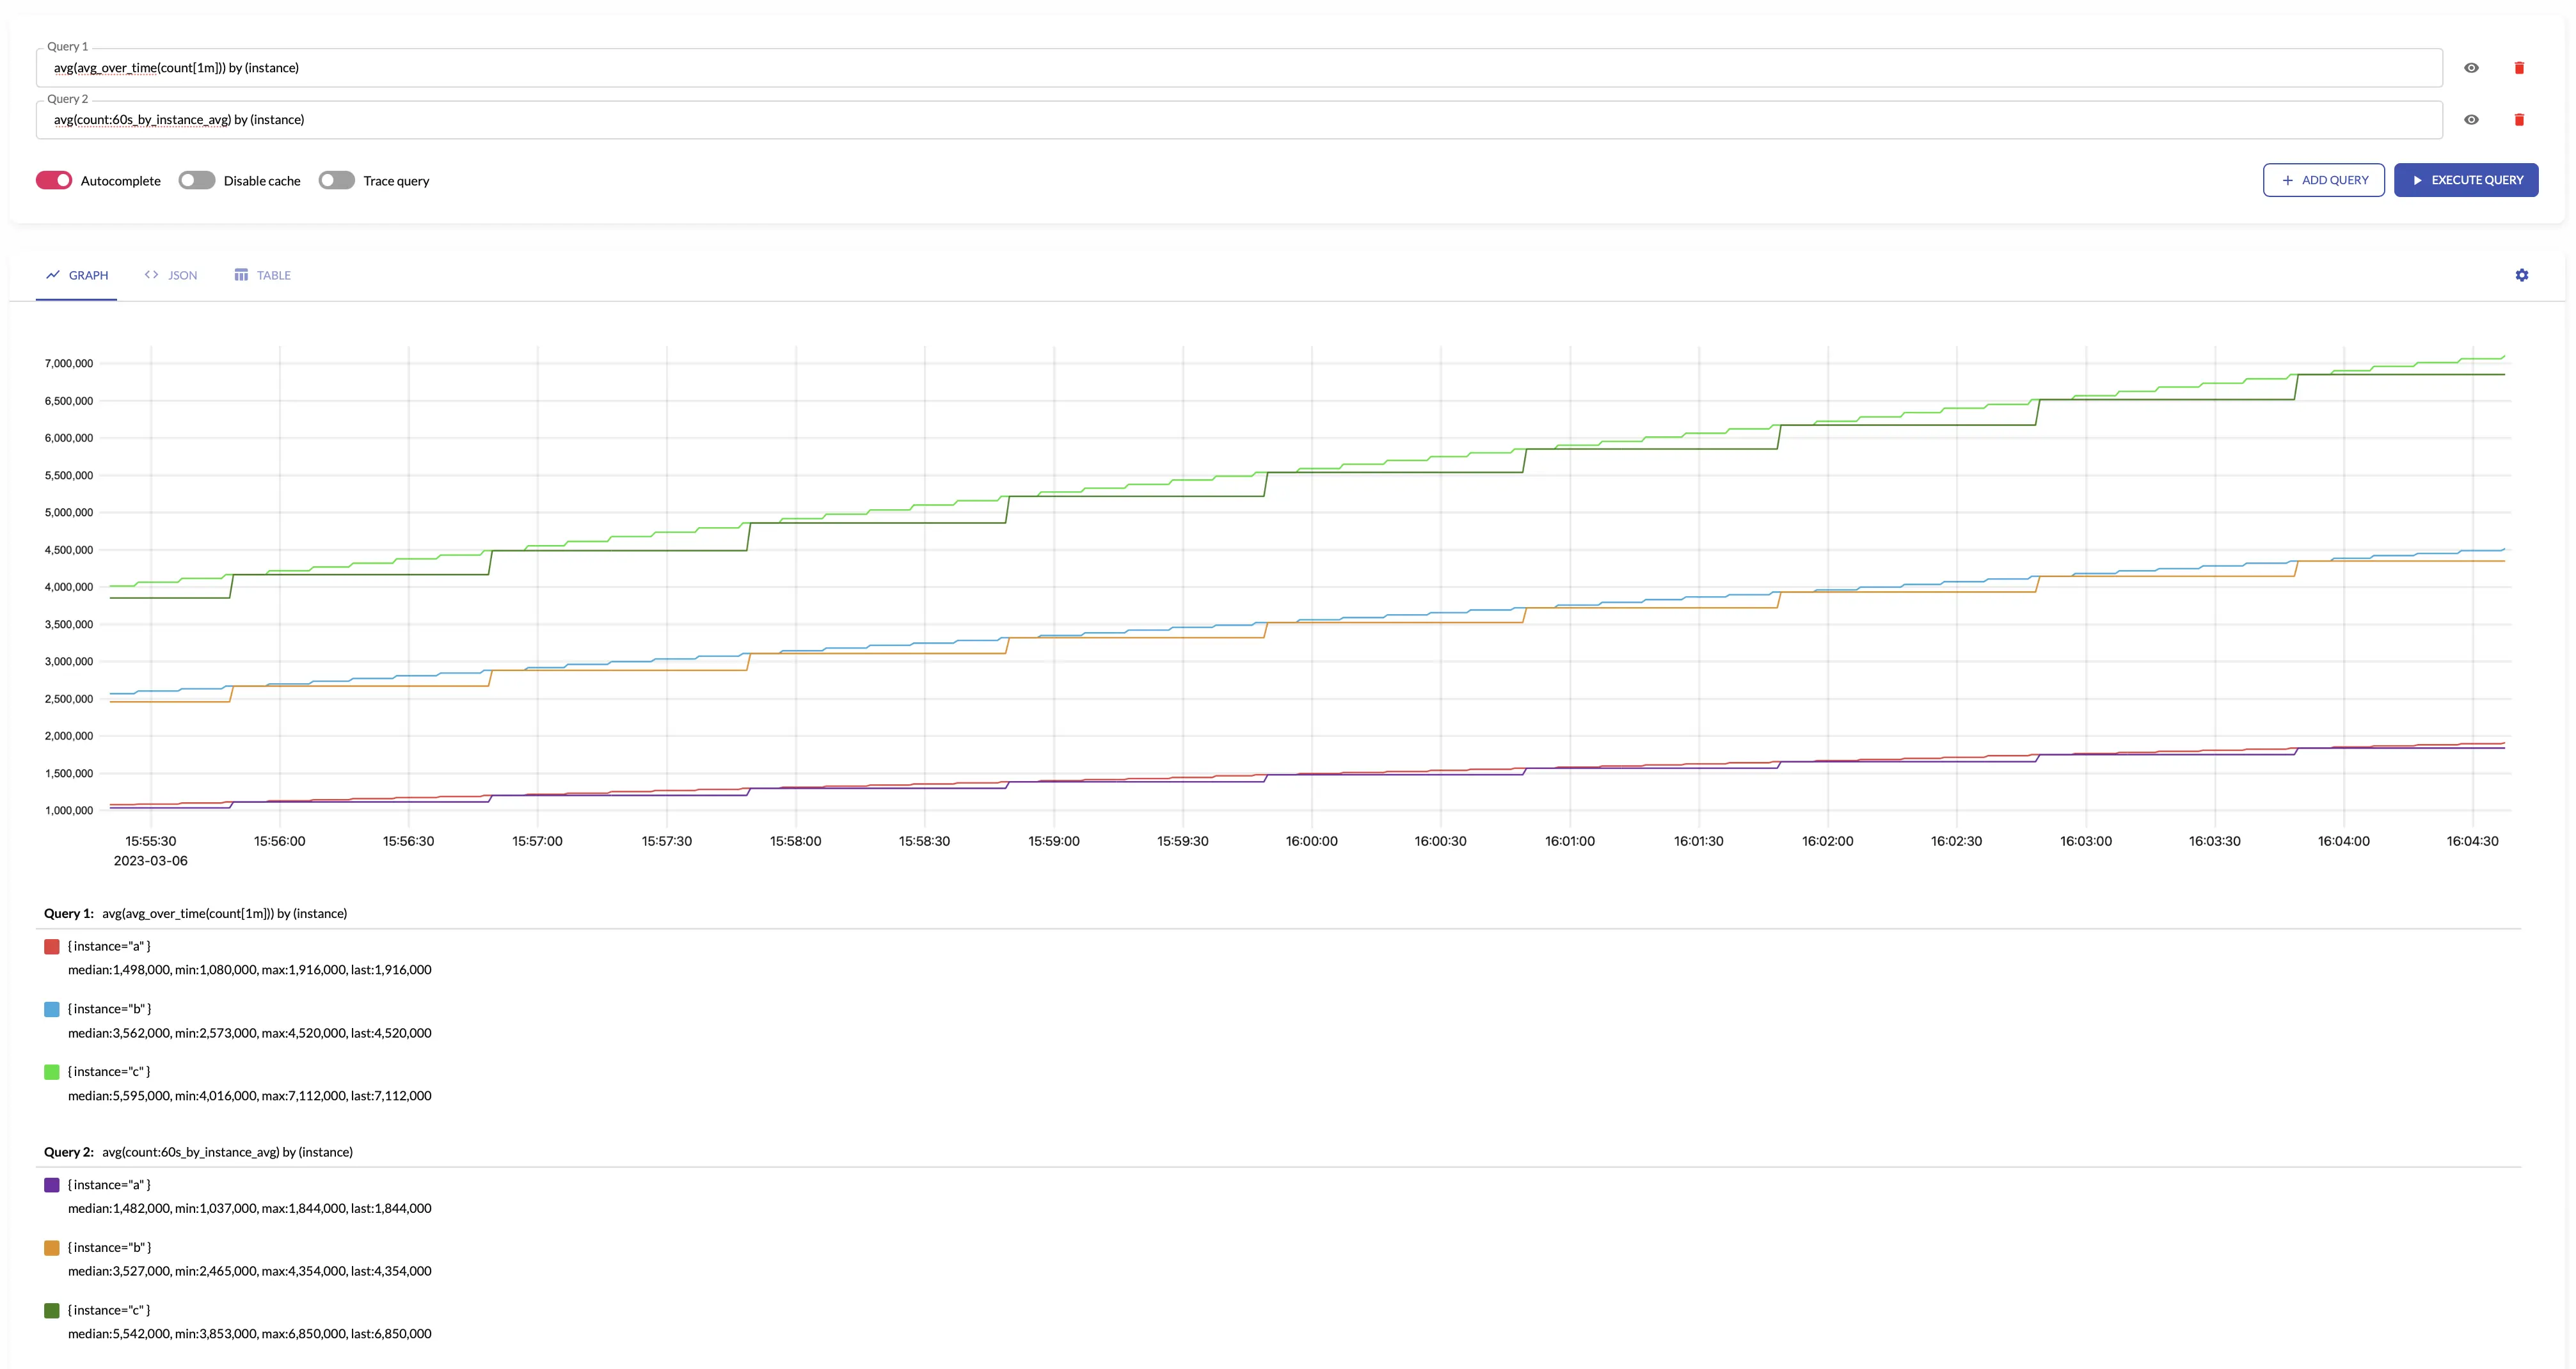
avg returns the average over input sample values.
avg makes sense only for aggregating gauges.
The results of avg is equal to the following MetricsQL query:
sum(sum_over_time(some_metric[interval])) / sum(count_over_time(some_metric[interval]))
For example, see below time series produced by config with aggregation interval 1m and by: ["instance"] and the regular query:
See also min, max, sum_samples and count_samples.
count_samples
count_samples counts the number of input samples over the given interval.
The results of count_samples is equal to the following MetricsQL query:
sum(count_over_time(some_metric[interval]))
See also count_series and sum_samples.
count_series
count_series counts the number of unique time series over the given interval.
The results of count_series is equal to the following MetricsQL query:
count(last_over_time(some_metric[interval]))
See also count_samples and unique_samples.
increase
increase returns the increase of input time series over the given 'interval'.
increase makes sense only for aggregating counters.
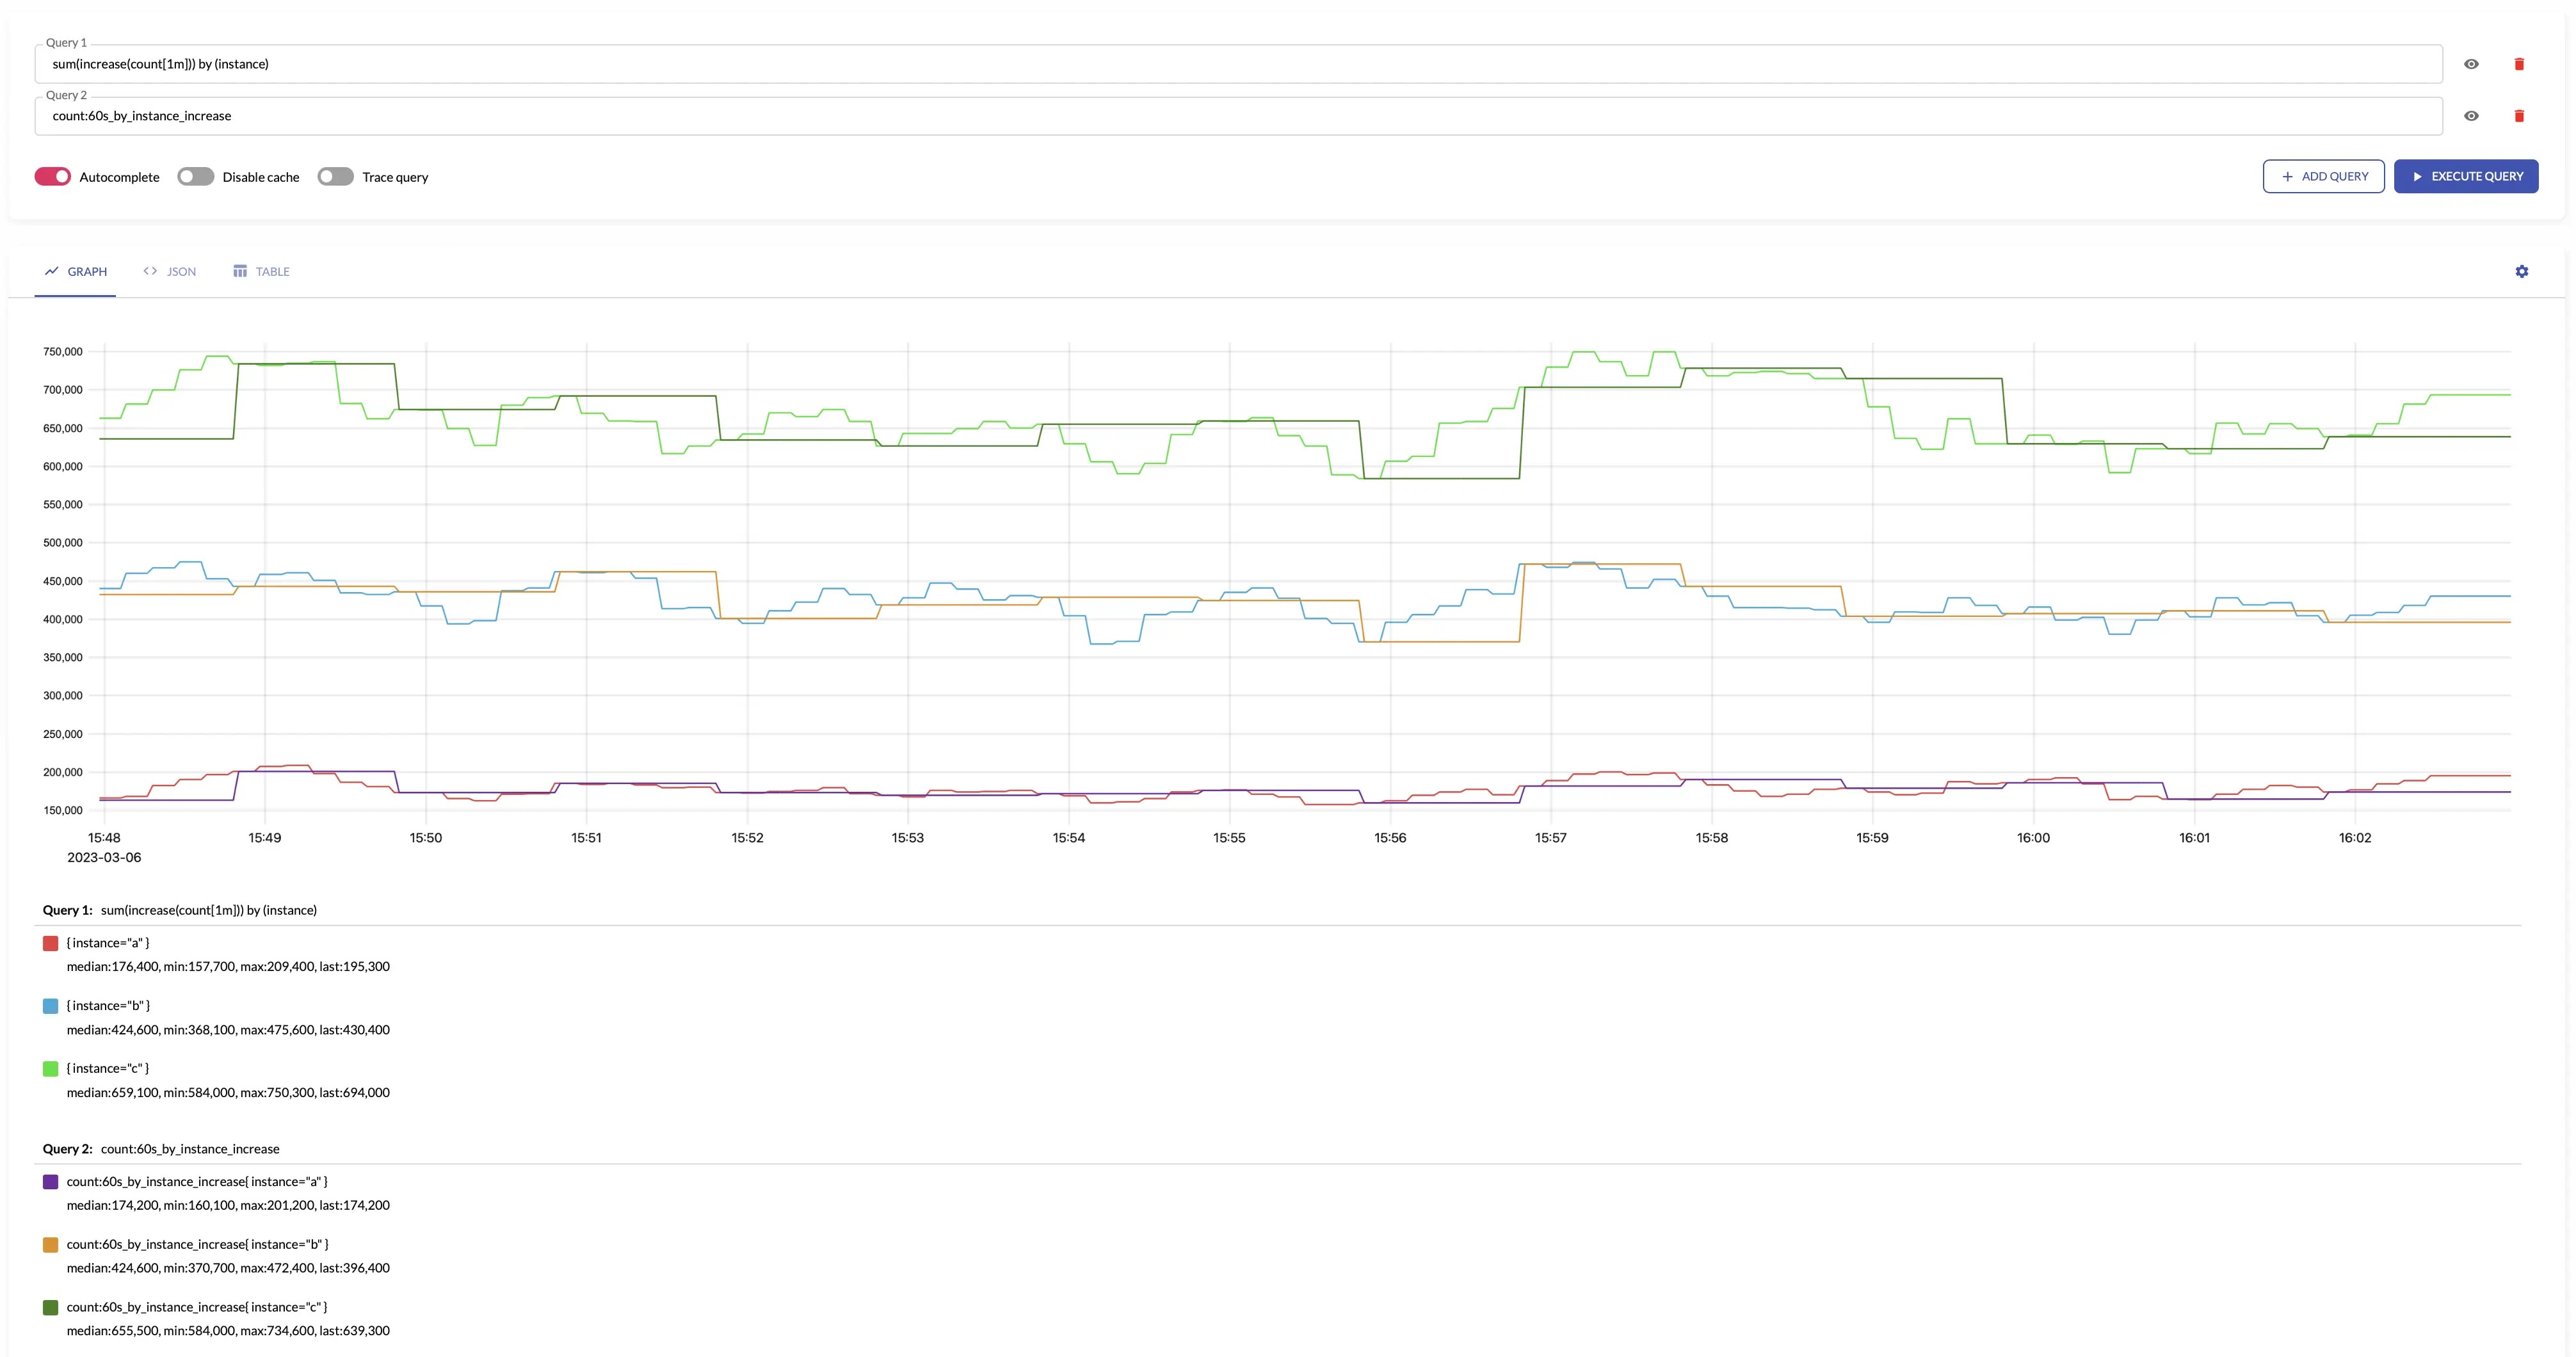
The results of increase is equal to the following MetricsQL query:
sum(increase_pure(some_counter[interval]))
increase assumes that all the counters start from 0. For example, if the fist seen sample for new time series
is 10, then increase assumes that the time series has been increased by 10. If you need ignoring the first sample for new time series,
then take a look at increase_prometheus.
For example, see below time series produced by config with aggregation interval 1m and by: ["instance"] and the regular query:
increase can be used as an alternative for rate function.
For example, if increase is calculated for some_counter with interval: 5m, then rate can be calculated
by dividing the resulting aggregation by 5m:
some_counter:5m_increase / 5m
This is similar to rate(some_counter[5m]).
Please note, opposite to rate, increase aggregations can be
combined safely afterwards. This is helpful when the aggregation is calculated by more than one vmagent.
Aggregating irregular and sporadic metrics (received from Lambdas or Cloud Functions) can be controlled via staleness_interval option.
See also increase_prometheus and total.
increase_prometheus
increase_prometheus returns the increase of input time series over the given interval.
increase_prometheus makes sense only for aggregating counters.
The results of increase_prometheus is equal to the following MetricsQL query:
sum(increase_prometheus(some_counter[interval]))
increase_prometheus skips the first seen sample value per each time series.
If you need taking into account the first sample per time series, then take a look at increase.
Aggregating irregular and sporadic metrics (received from Lambdas or Cloud Functions) can be controlled via staleness_interval option.
See also increase, total and total_prometheus.
histogram_bucket
histogram_bucket returns VictoriaMetrics histogram buckets
for the input sample values over the given interval.
histogram_bucket makes sense only for aggregating gauges.
See how to aggregate regular histograms here.
The results of histogram_bucket is equal to the following MetricsQL query:
Aggregating irregular and sporadic metrics (received from Lambdas or Cloud Functions) can be controlled via staleness_interval option.
sum(histogram_over_time(some_histogram_bucket[interval])) by (vmrange)
See also quantiles, min, max and avg.
last
last returns the last input sample value over the given interval.
The results of last is roughly equal to the the following MetricsQL query:
last_over_time(some_metric[interval])
max
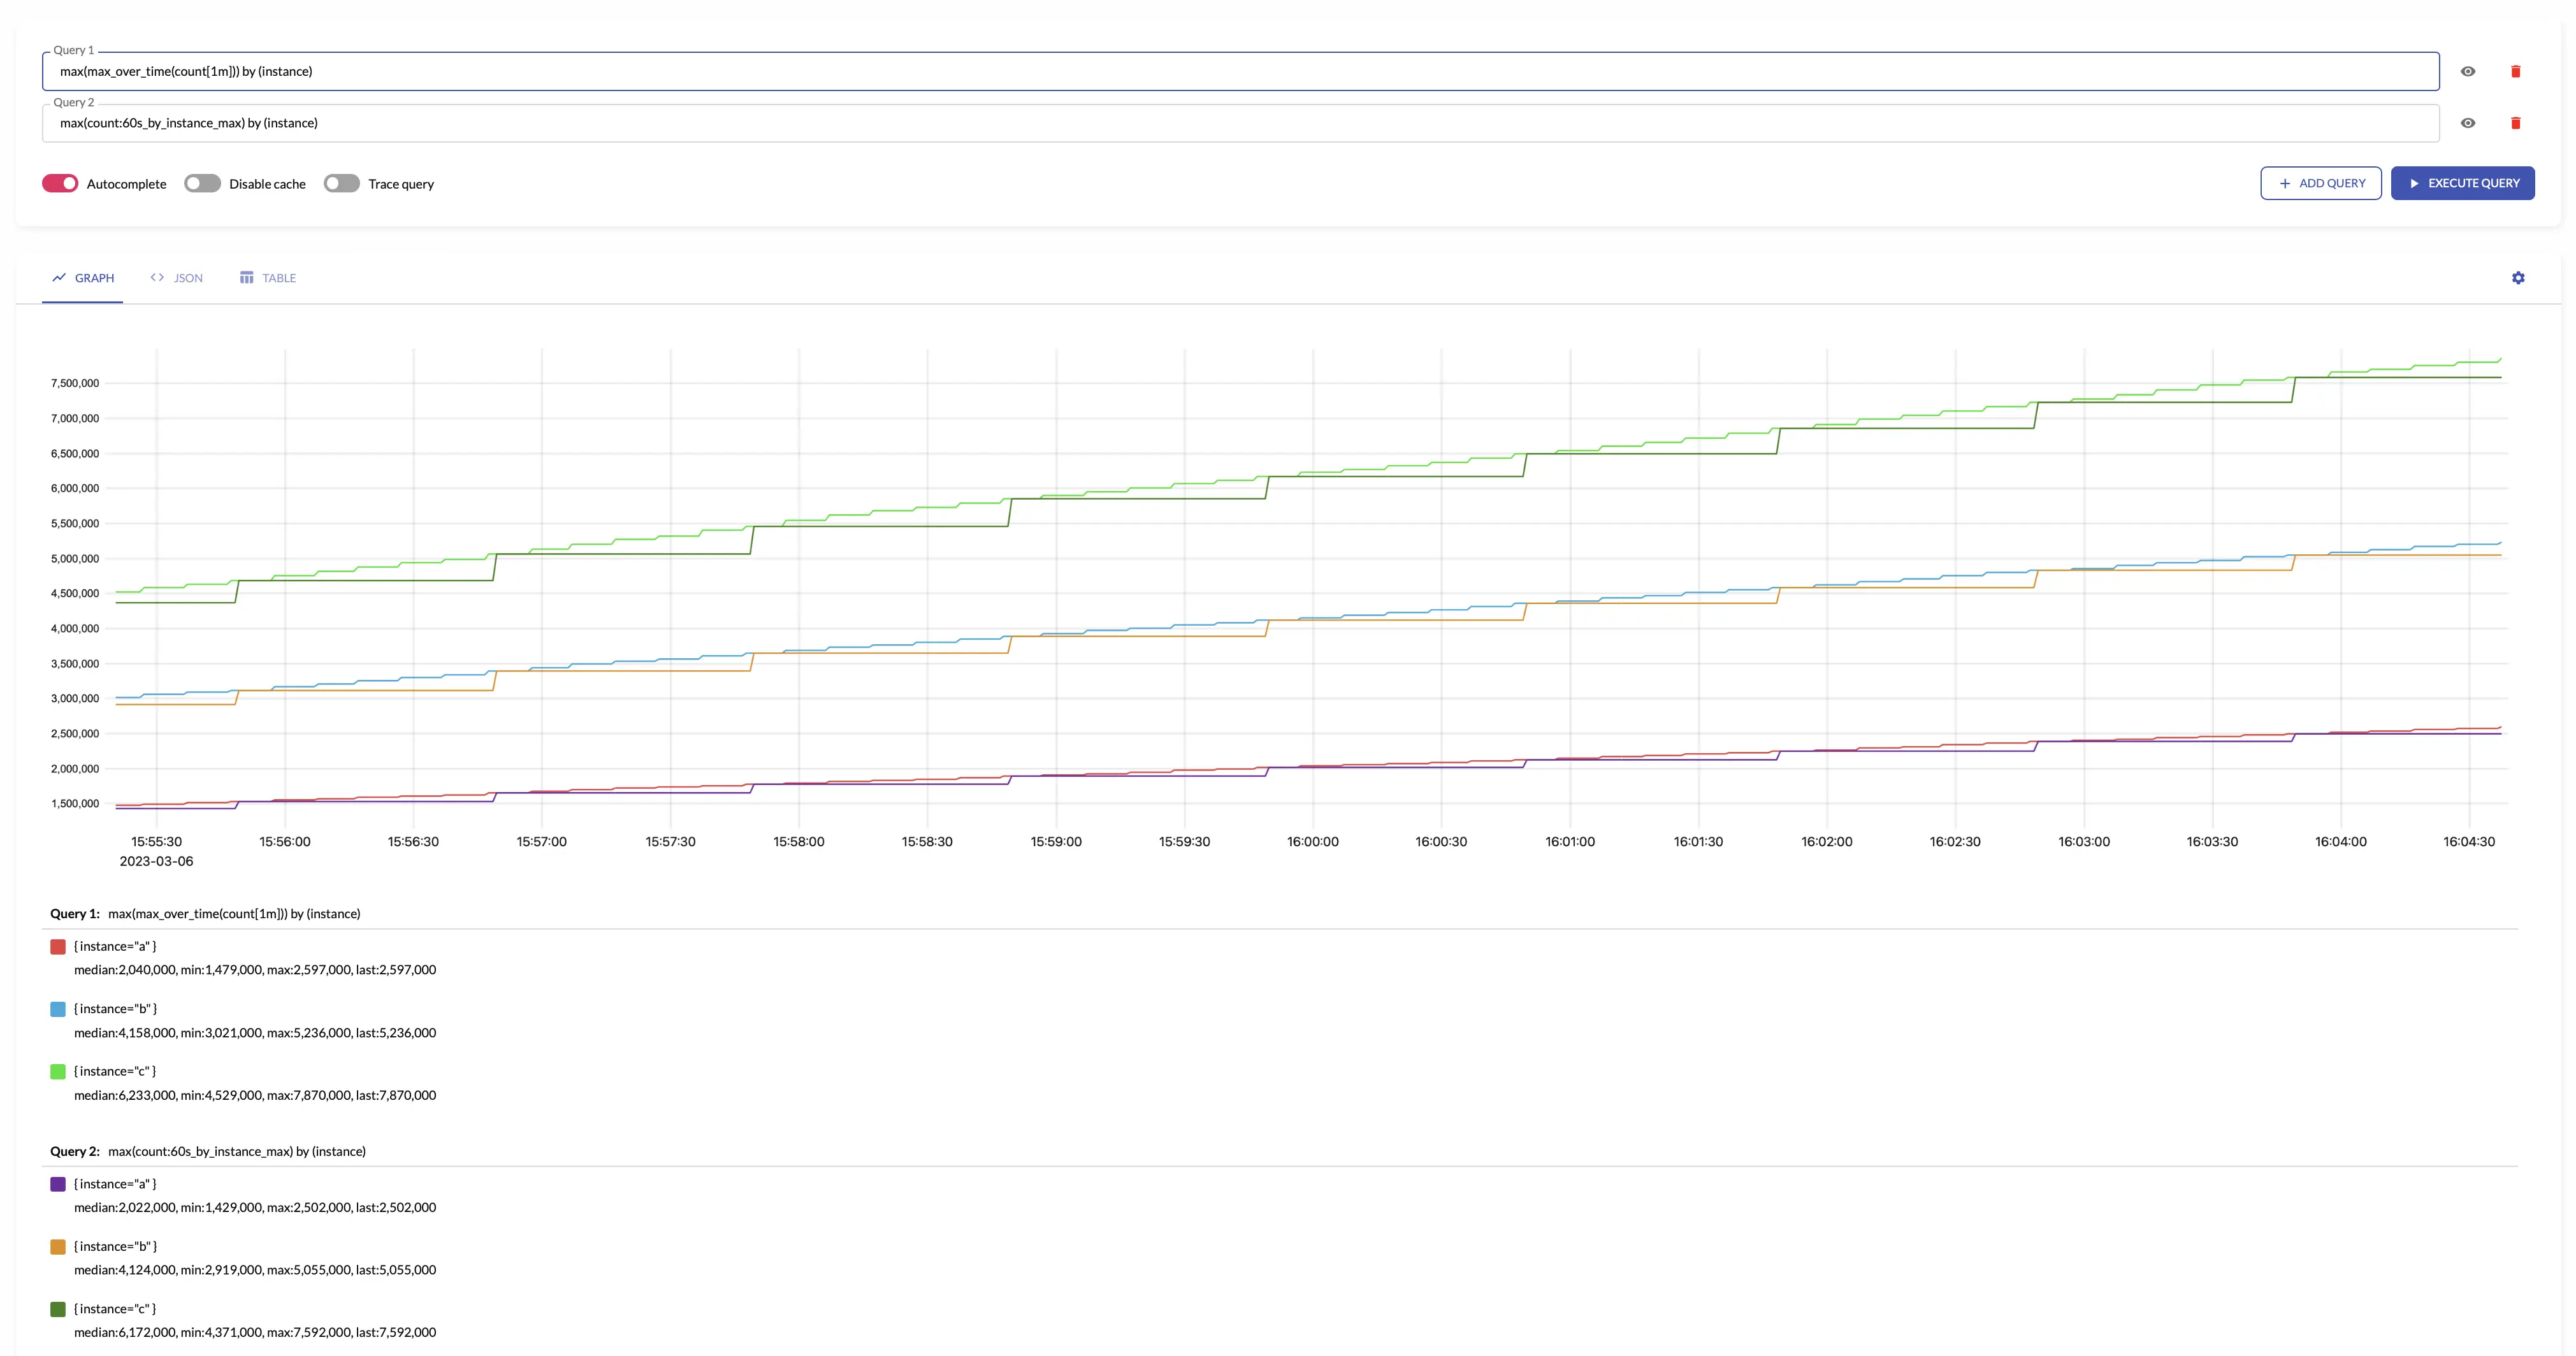
max returns the maximum input sample value over the given interval.
The results of max is equal to the following MetricsQL query:
max(max_over_time(some_metric[interval]))
For example, see below time series produced by config with aggregation interval 1m and the regular query:
min
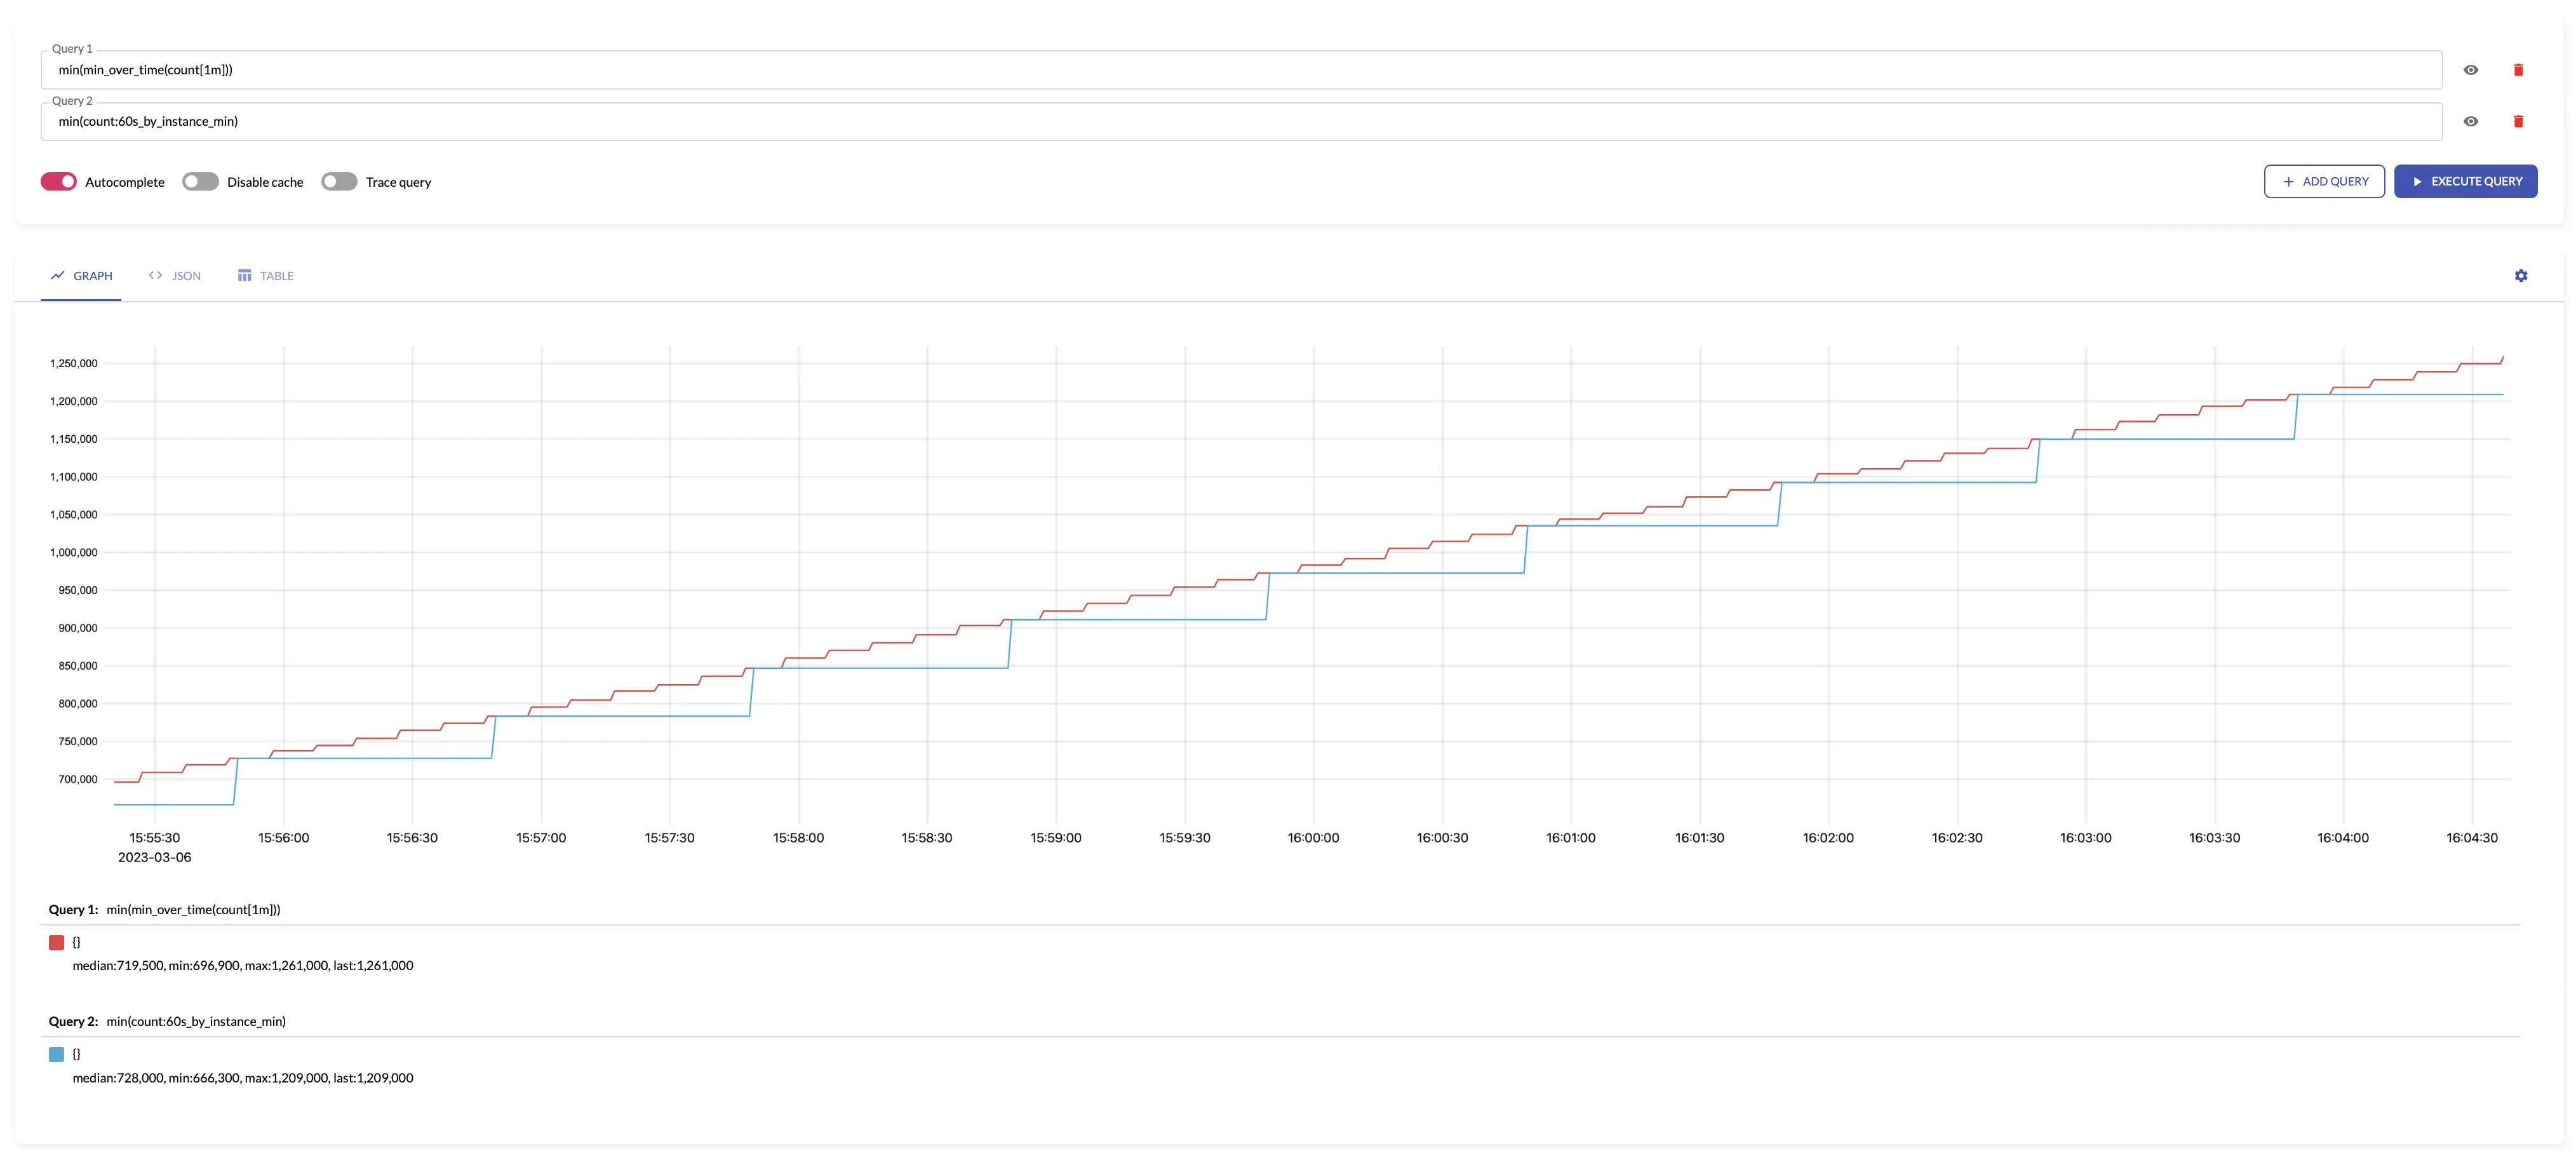
min returns the minimum input sample value over the given interval.
The results of min is equal to the following MetricsQL query:
min(min_over_time(some_metric[interval]))
For example, see below time series produced by config with aggregation interval 1m and the regular query:
stddev
stddev returns standard deviation for the input sample values
over the given interval.
stddev makes sense only for aggregating gauges.
The results of stddev is roughly equal to the following MetricsQL query:
histogram_stddev(sum(histogram_over_time(some_metric[interval])) by (vmrange))
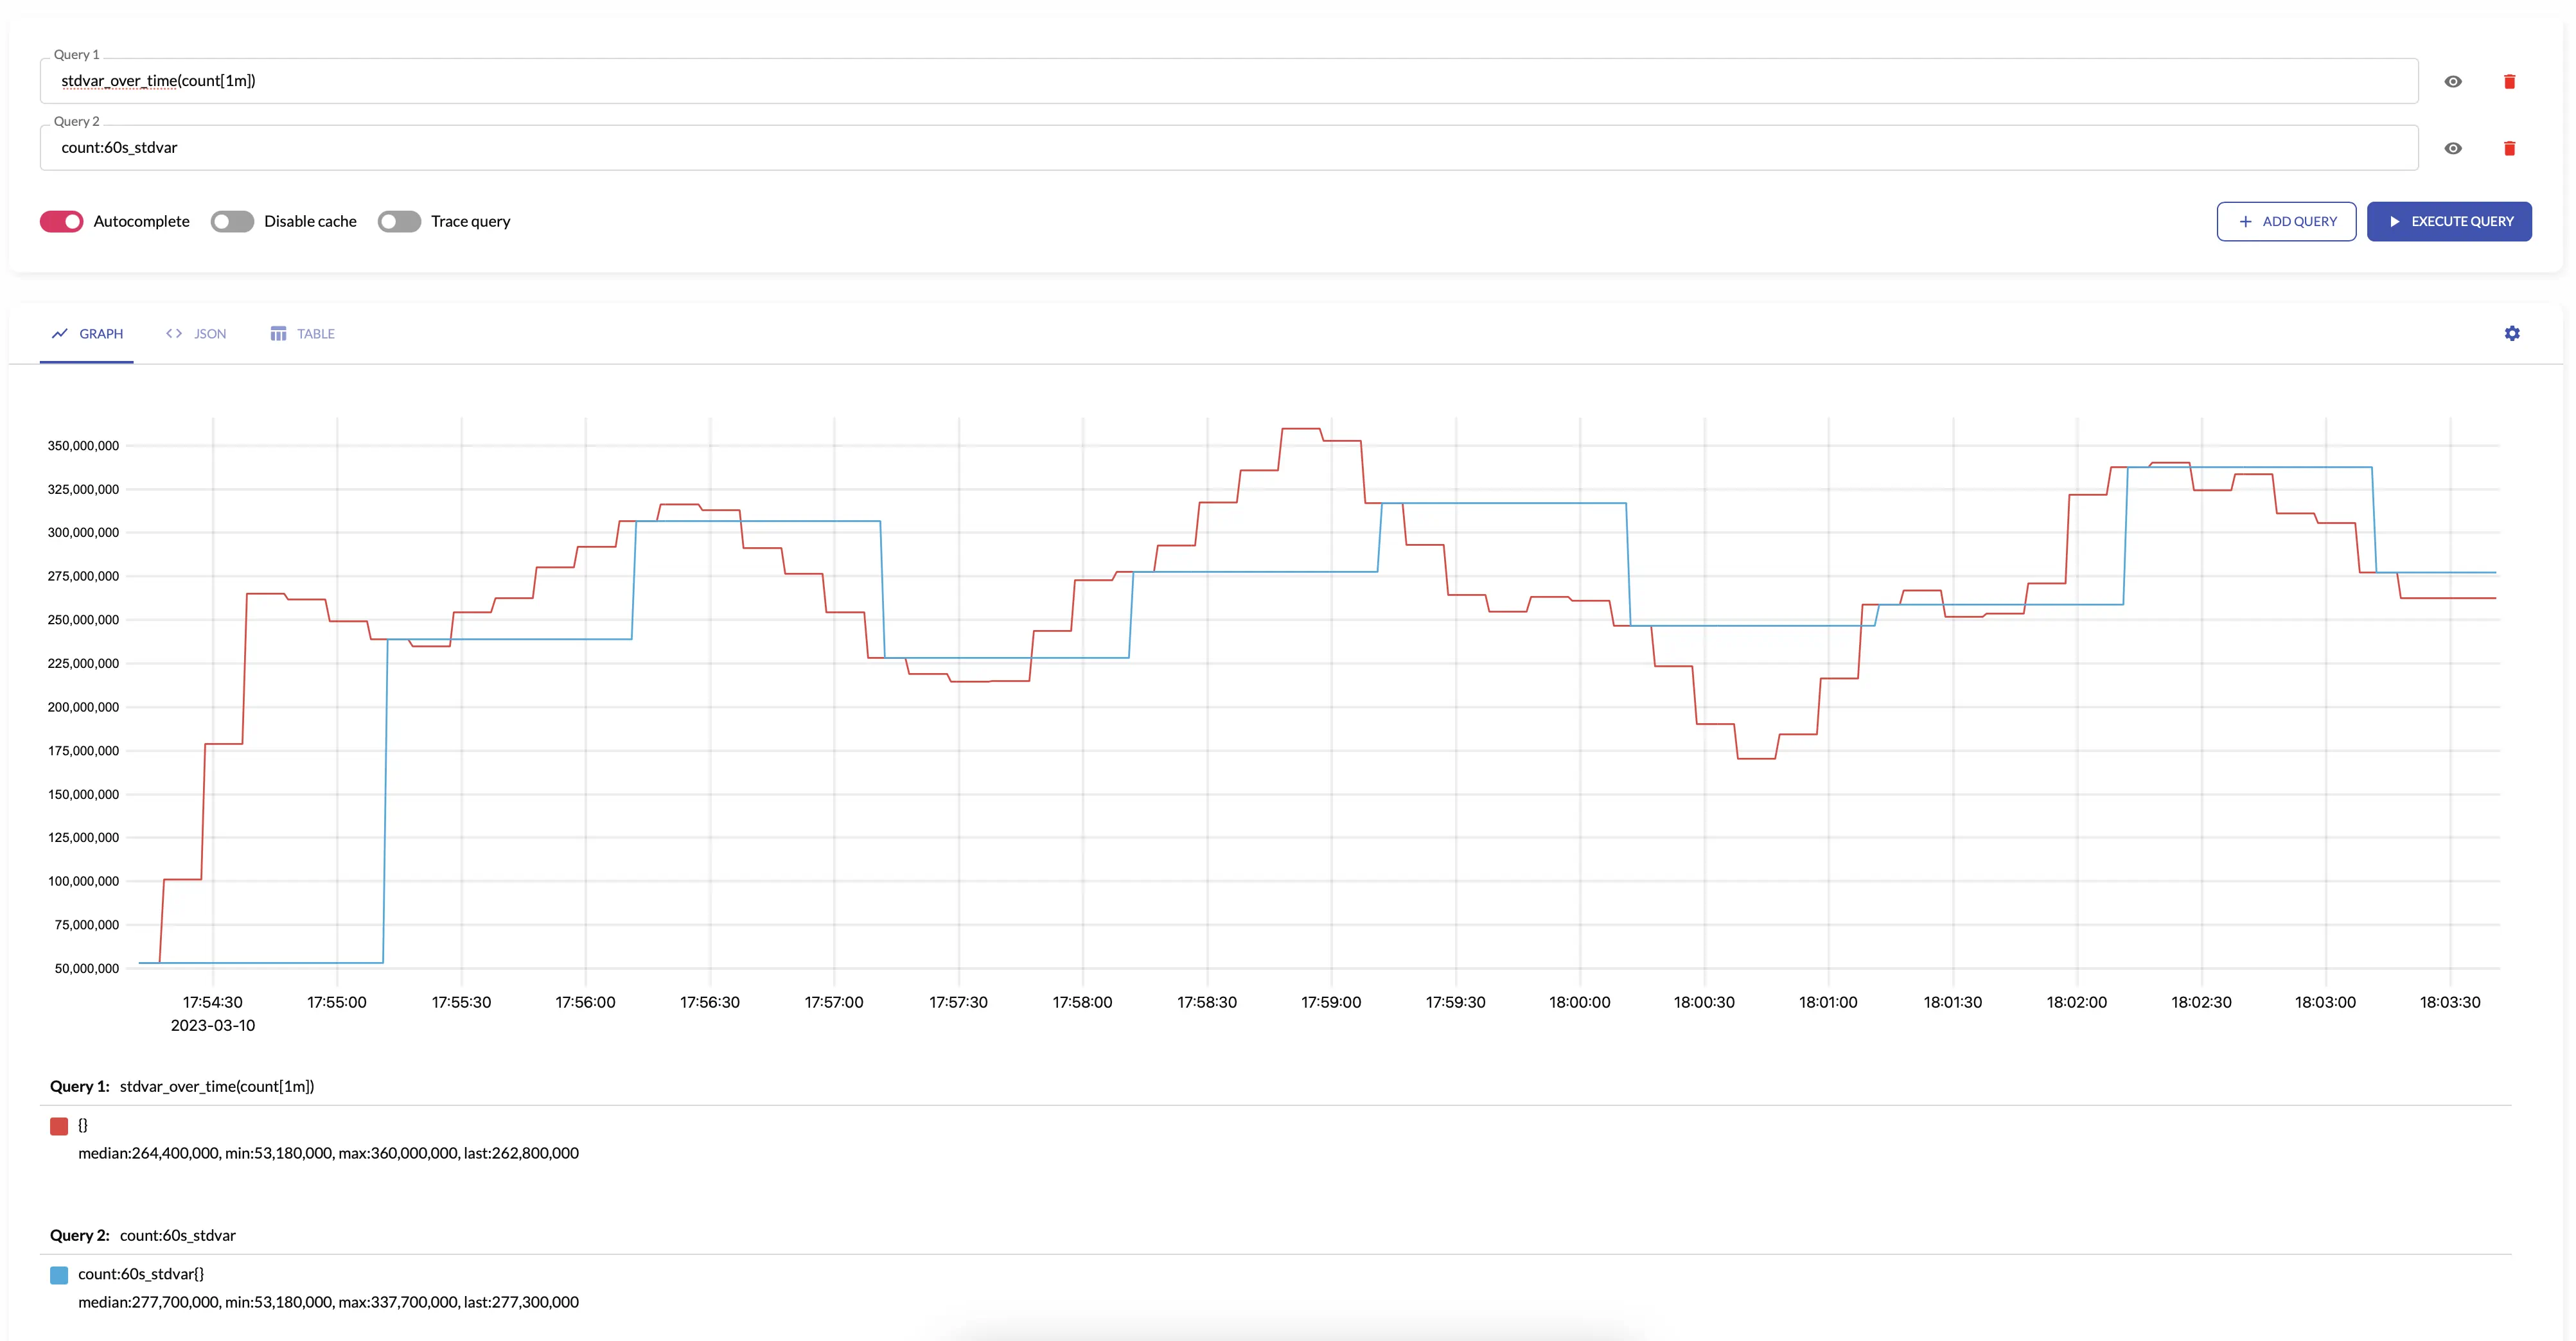
stdvar
stdvar returns standard variance for the input sample values
over the given interval.
stdvar makes sense only for aggregating gauges.
The results of stdvar is roughly equal to the following MetricsQL query:
histogram_stdvar(sum(histogram_over_time(some_metric[interval])) by (vmrange))
For example, see below time series produced by config with aggregation interval 1m and the regular query:
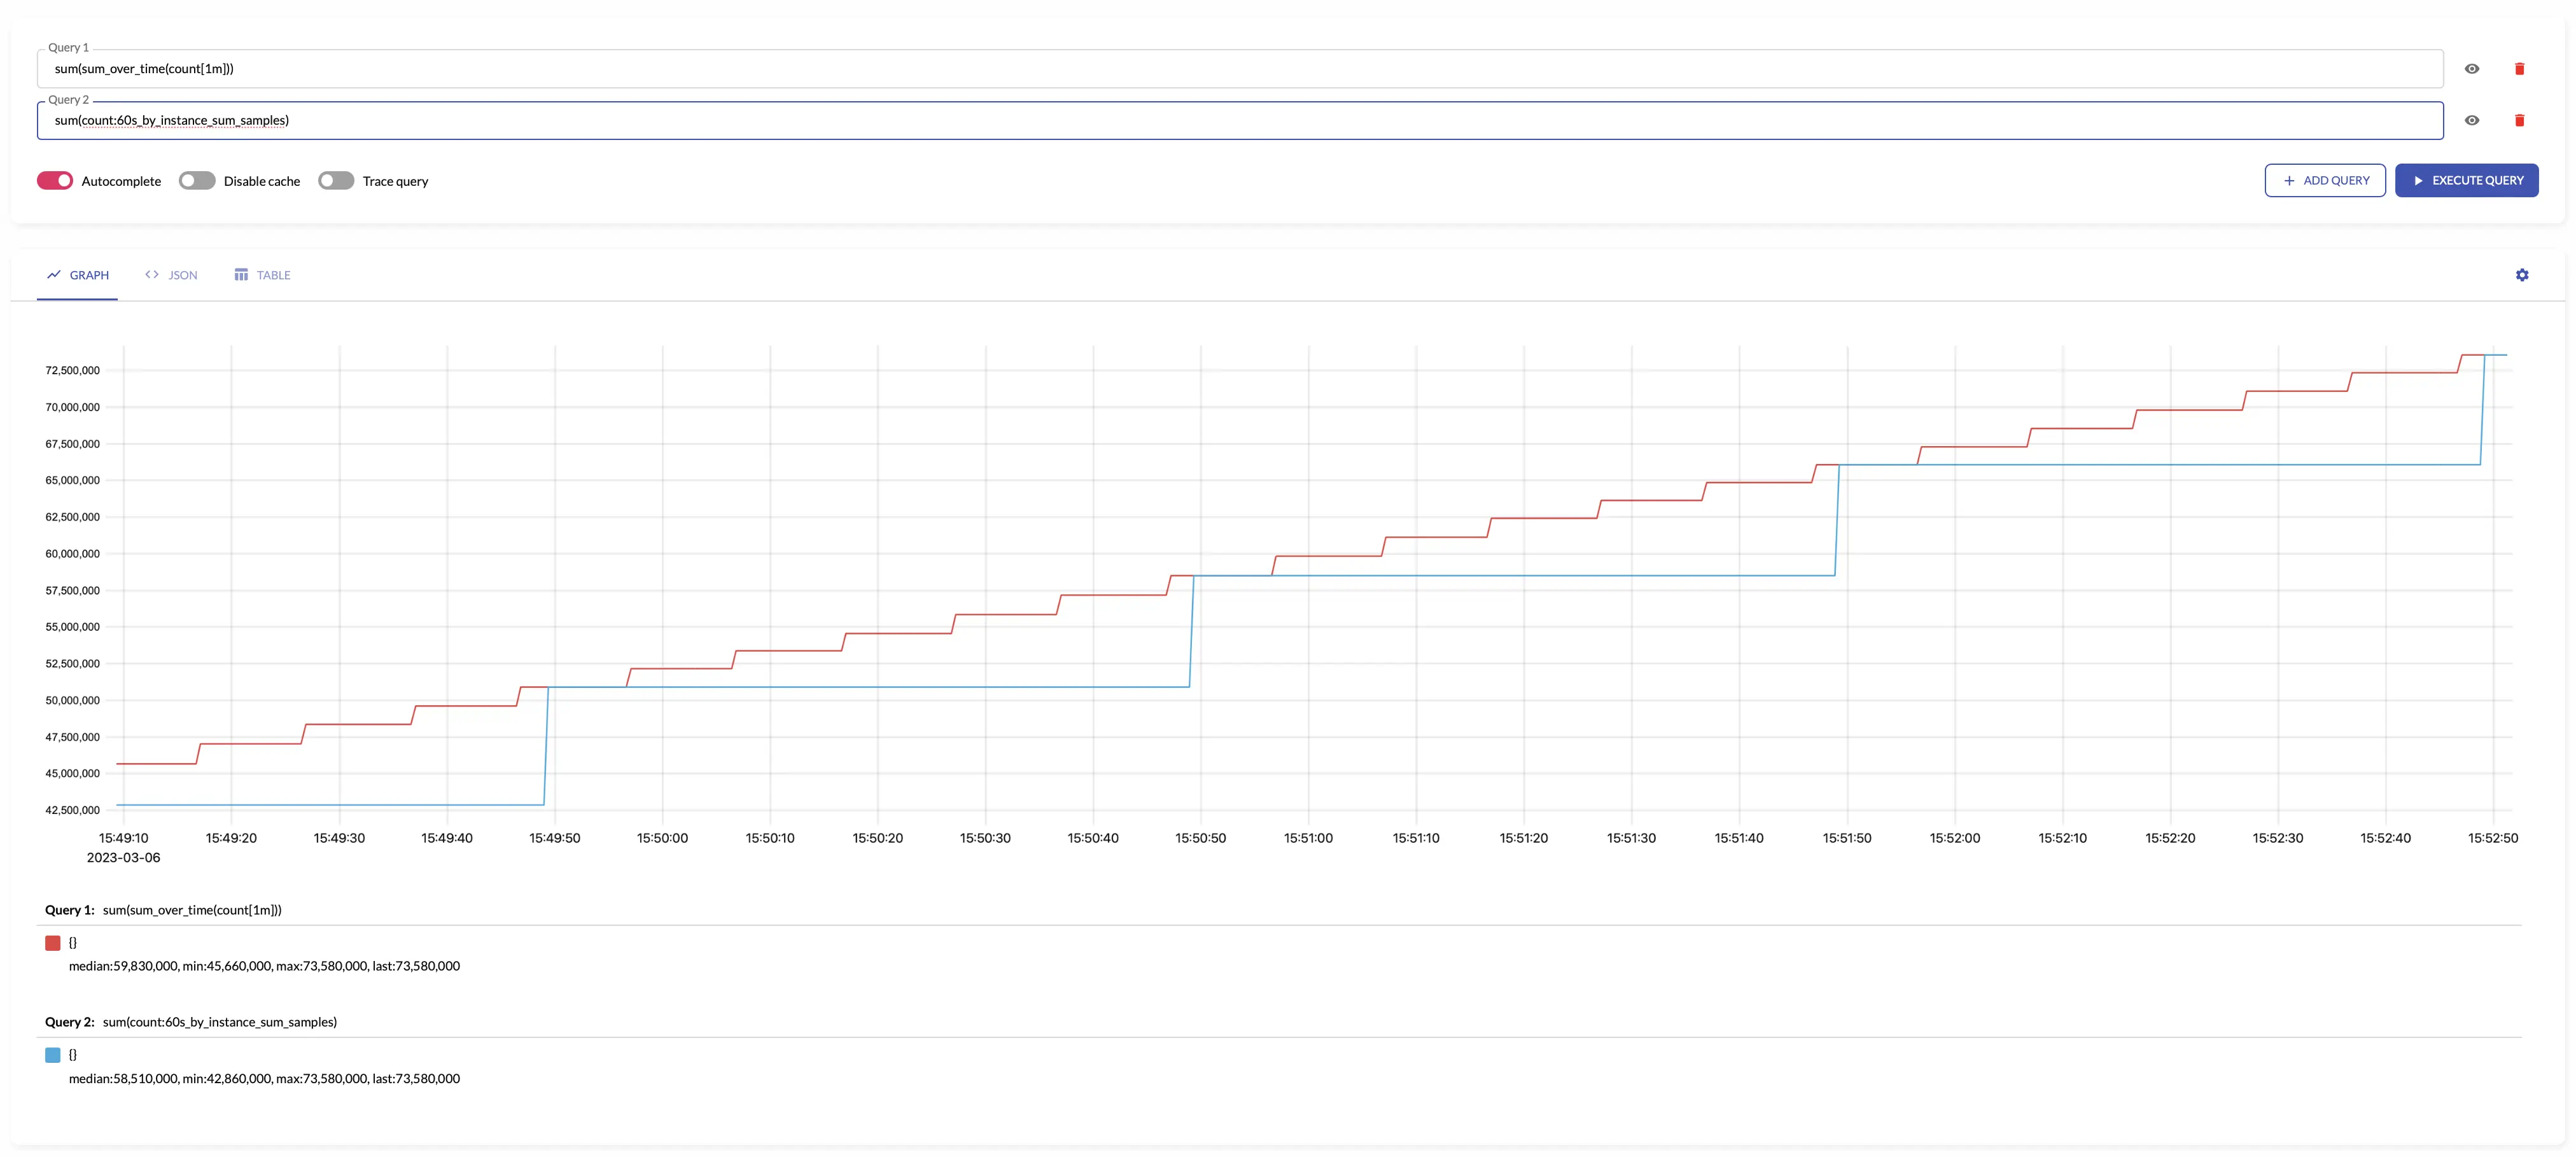
sum_samples
sum_samples sums input sample values over the given interval.
sum_samples makes sense only for aggregating gauges.
The results of sum_samples is equal to the following MetricsQL query:
sum(sum_over_time(some_metric[interval]))
For example, see below time series produced by config with aggregation interval 1m and the regular query:
See also count_samples and count_series.
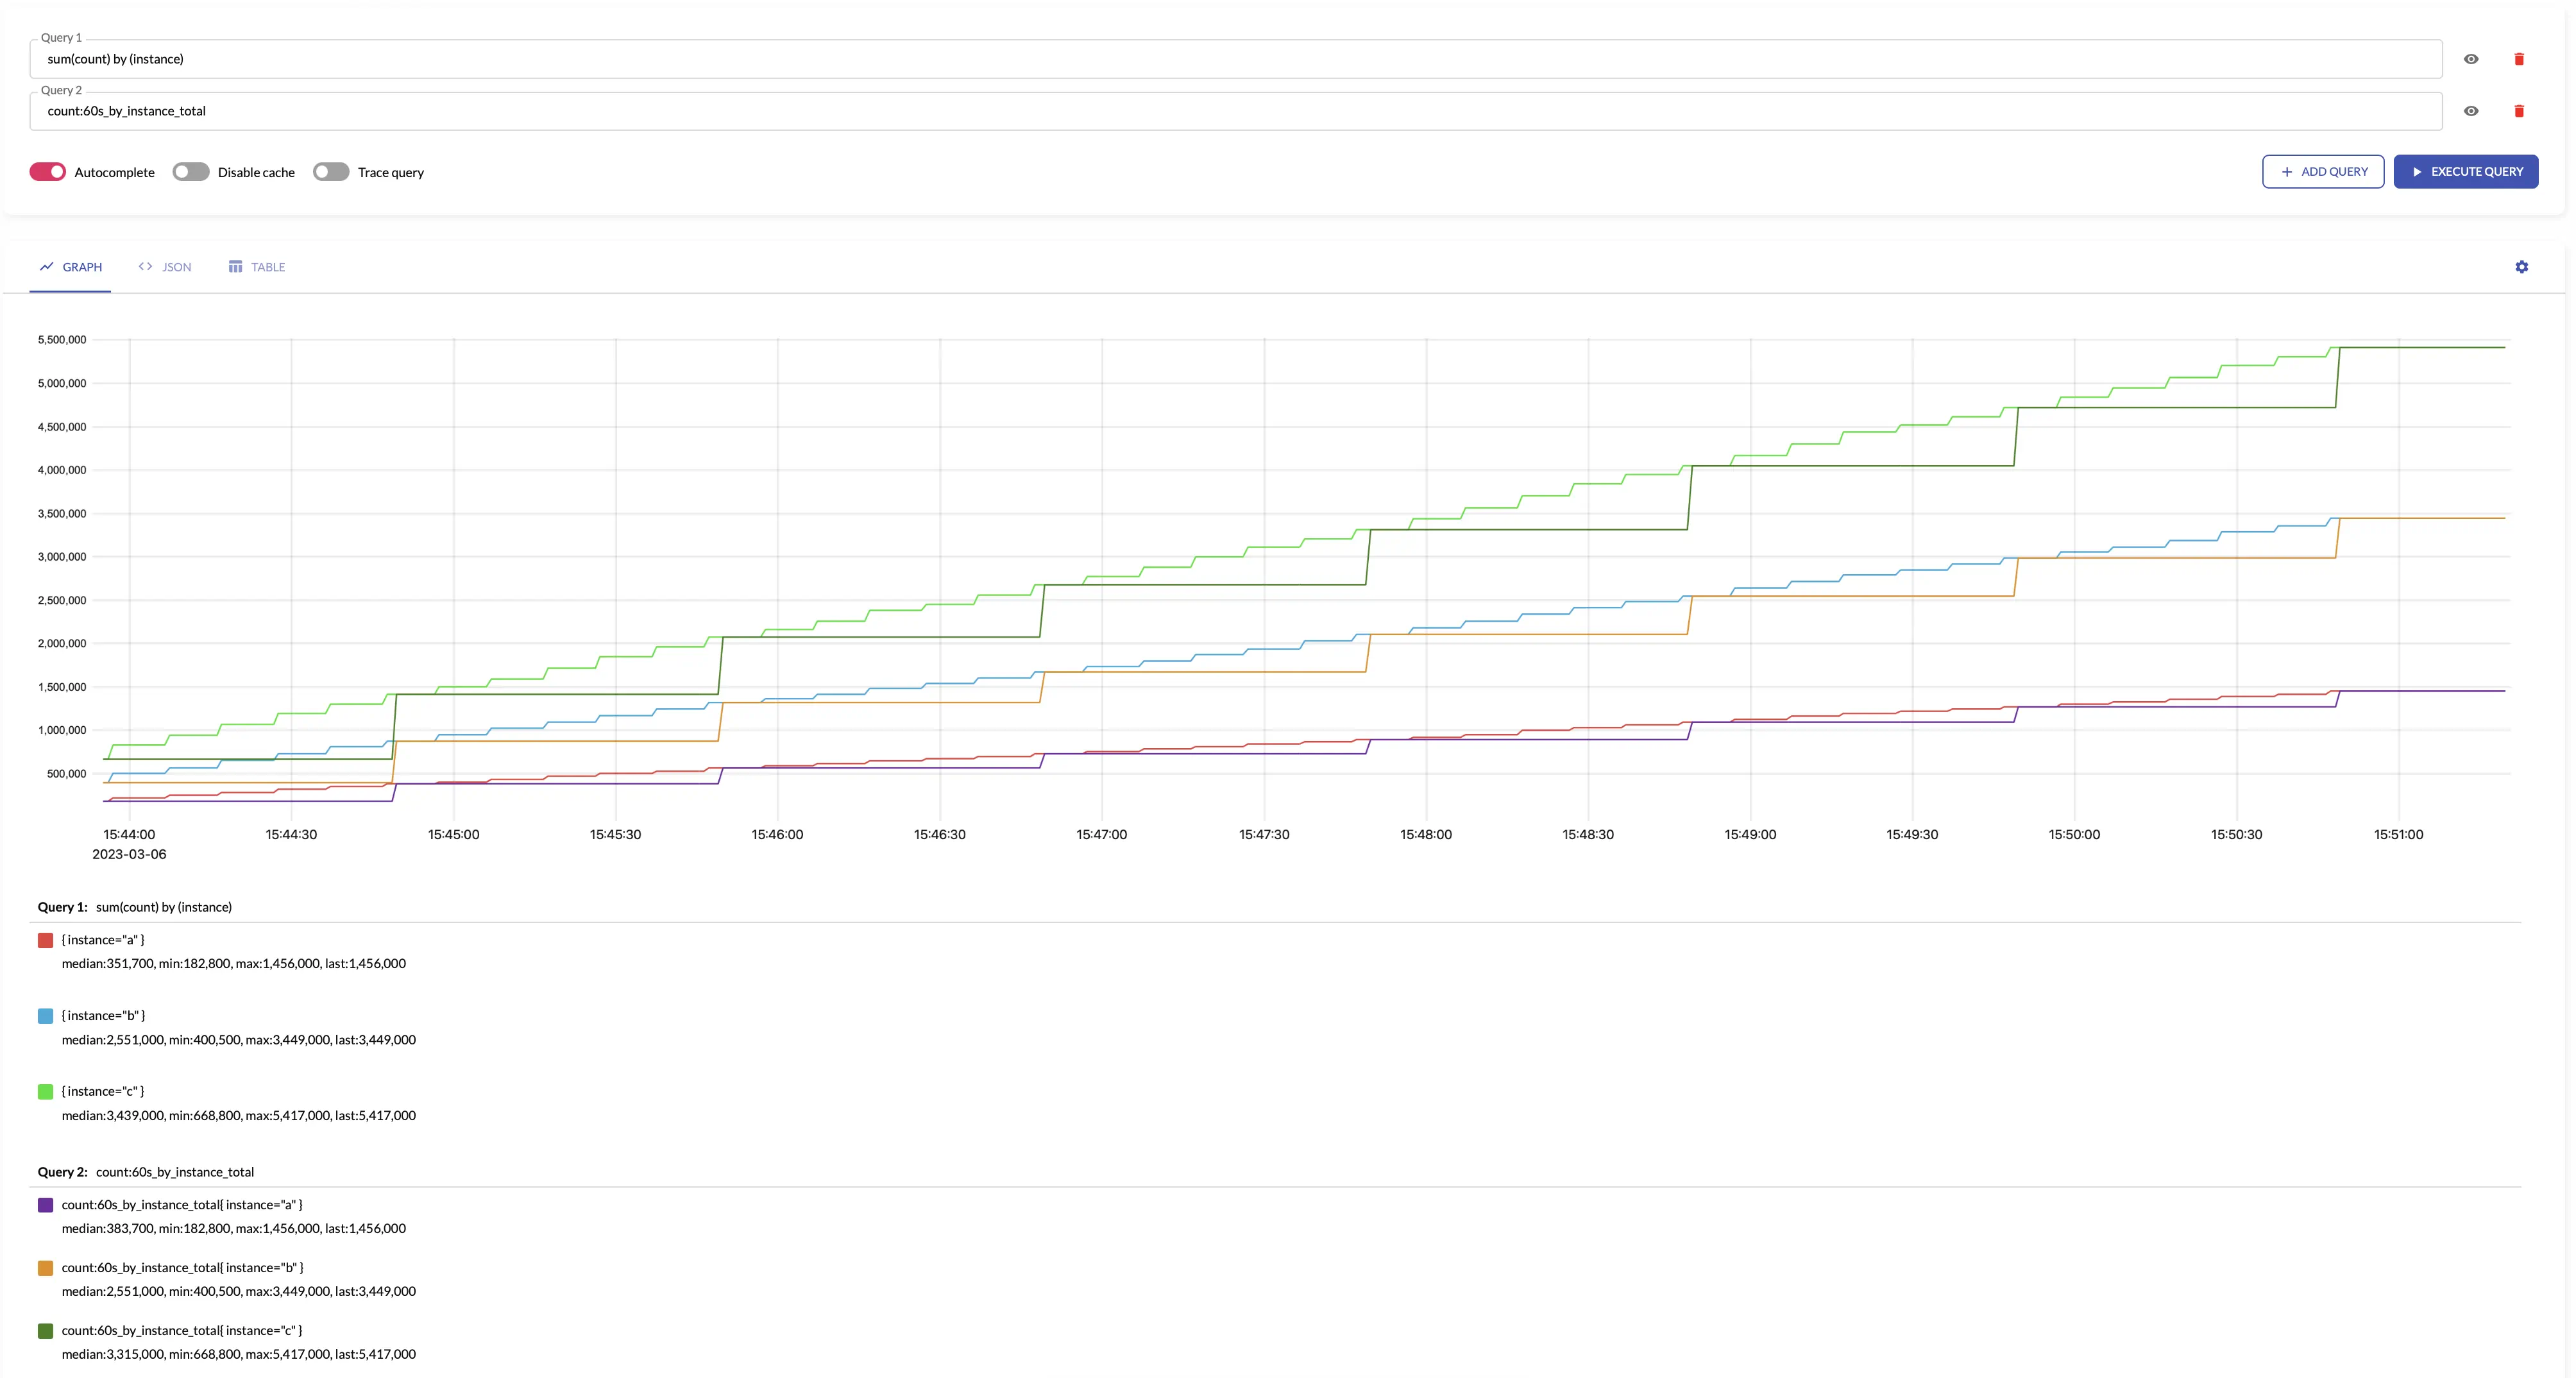
total
total generates output counter by summing the input counters over the given interval.
total makes sense only for aggregating counters.
The results of total is roughly equal to the the following MetricsQL query:
sum(running_sum(increase_pure(some_counter)))
total assumes that all the counters start from 0. For example, if the fist seen sample for new time series
is 10, then total assumes that the time series has been increased by 10. If you need ignoring the first sample for new time series,
then take a look at total_prometheus.
For example, see below time series produced by config with aggregation interval 1m and by: ["instance"] and the regular query:
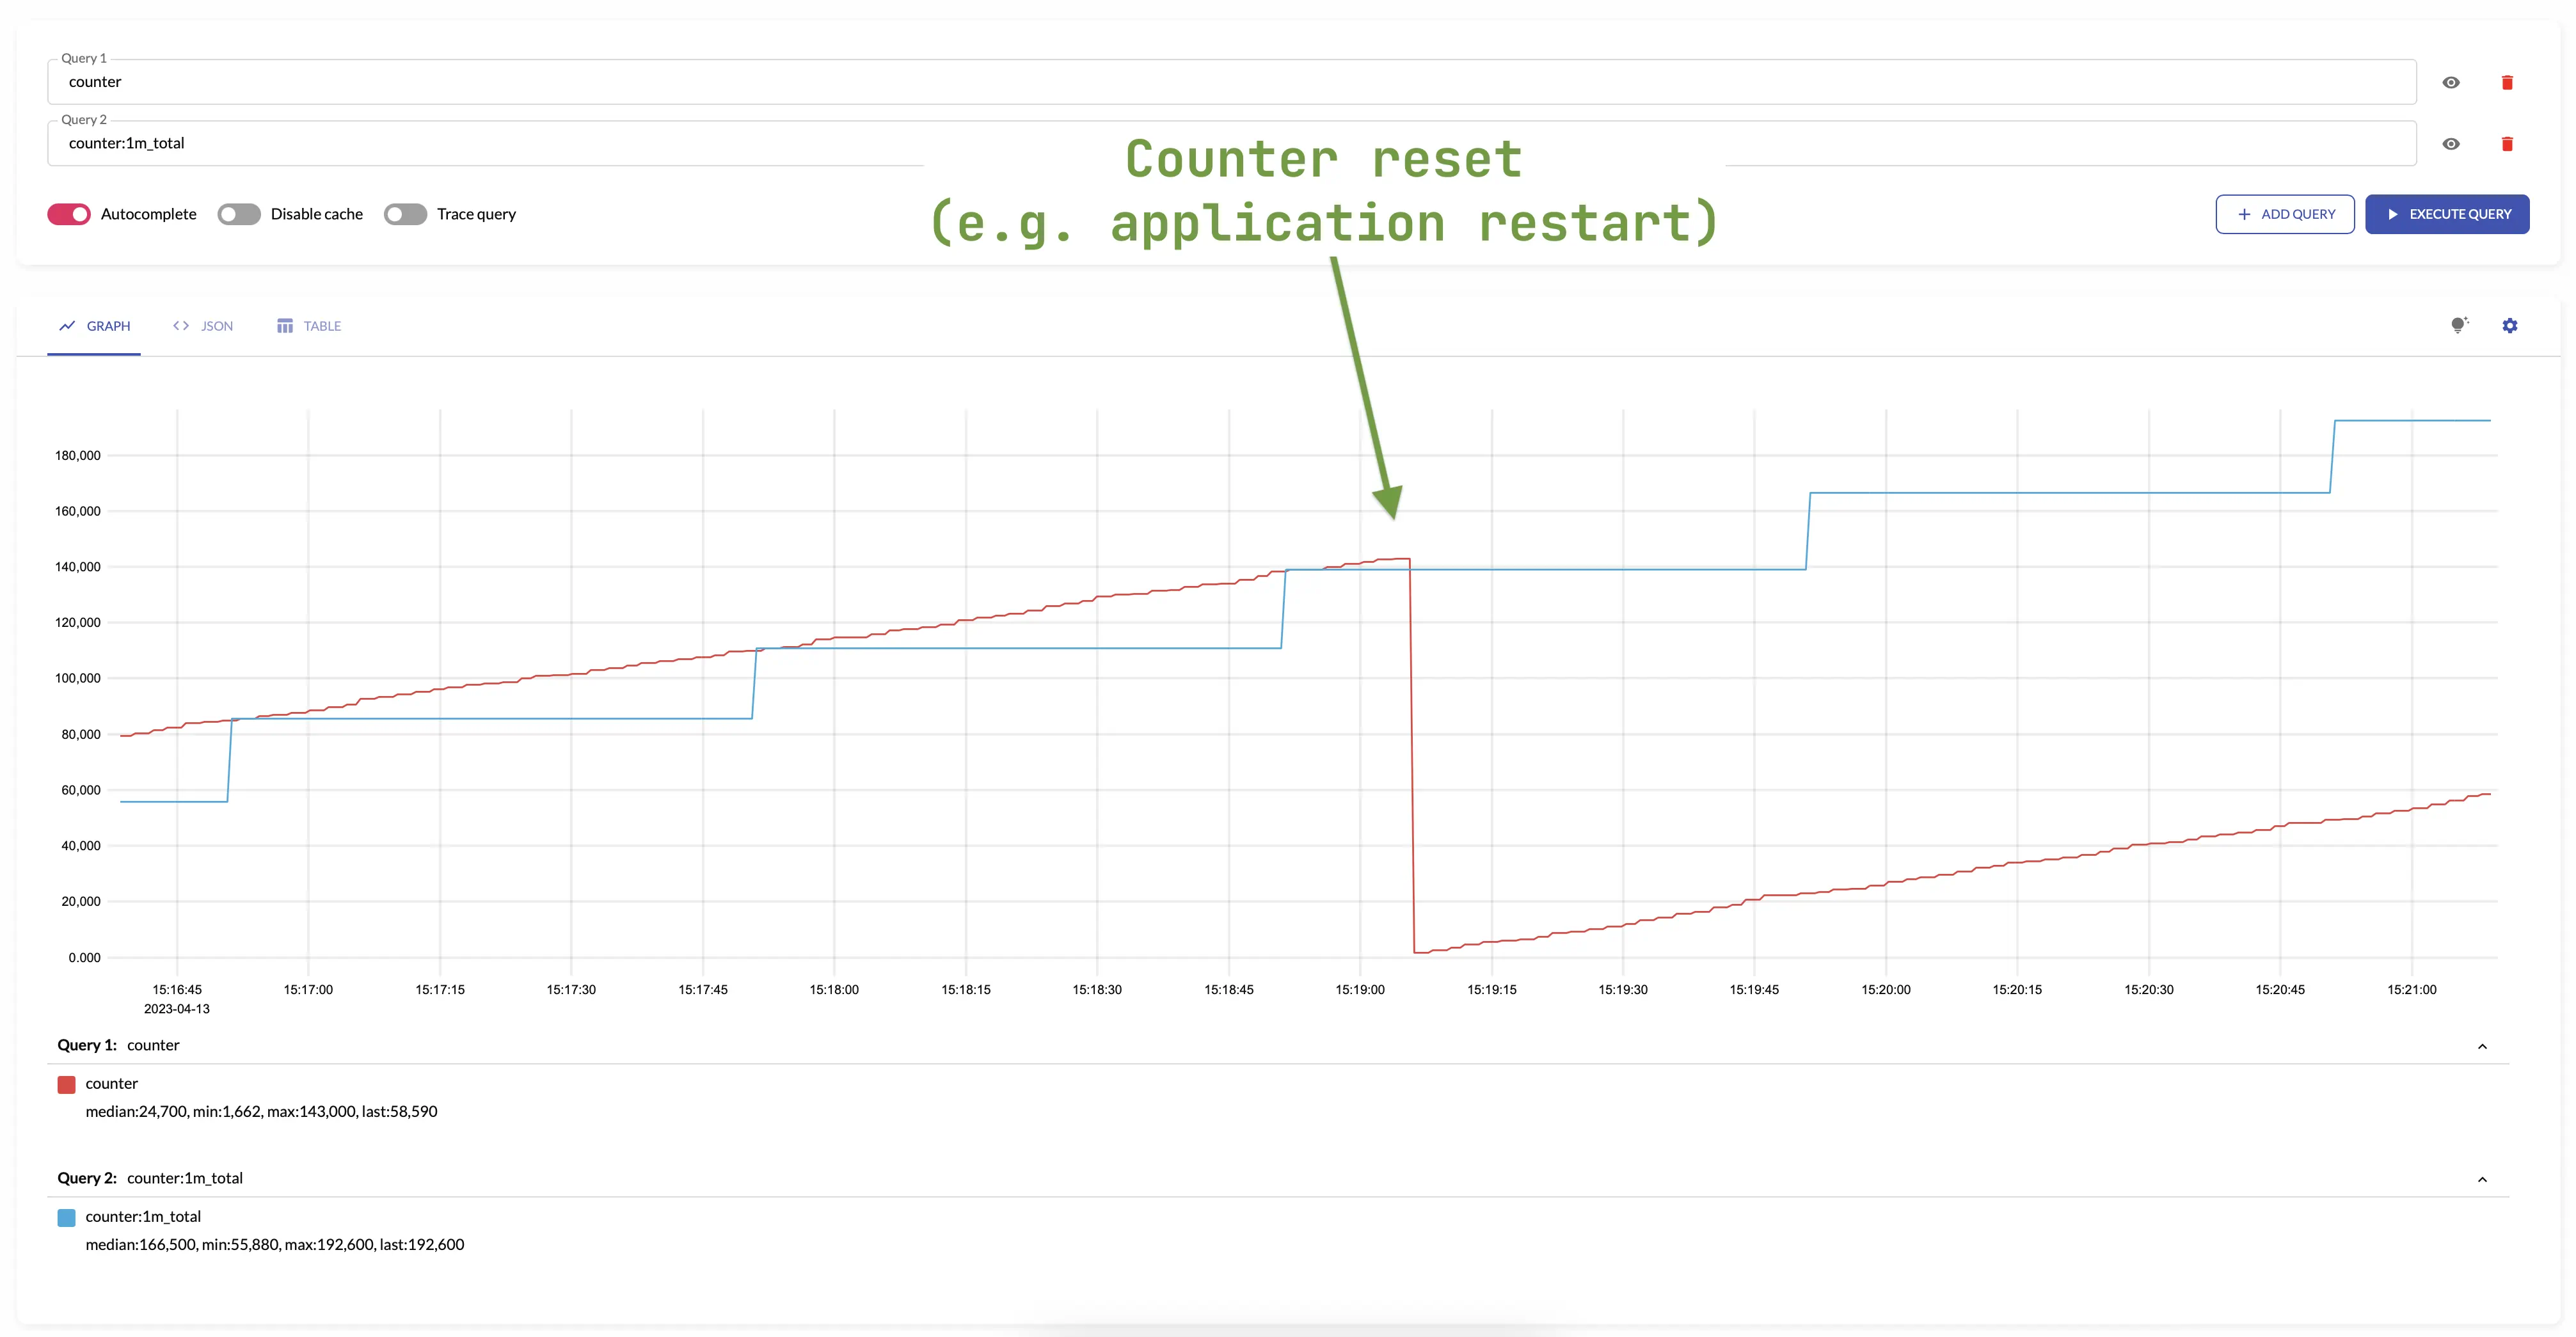
total is not affected by counter resets -
it continues to increase monotonically with respect to the previous value.
The counters are most often reset when the application is restarted.
For example:
The same behavior occurs when creating or deleting new series in an aggregation group -
total output increases monotonically considering the values of the series set.
An example of changing a set of series can be restarting a pod in the Kubernetes.
This changes pod name label, but the total accounts for such a scenario and doesn't reset the state of aggregated metric.
Aggregating irregular and sporadic metrics (received from Lambdas or Cloud Functions) can be controlled via staleness_interval option.
See also total_prometheus, increase and increase_prometheus.
total_prometheus
total_prometheus generates output counter by summing the input counters over the given interval.
total_prometheus makes sense only for aggregating counters.
The results of total_prometheus is roughly equal to the the following MetricsQL query:
sum(running_sum(increase_prometheus(some_counter)))
total_prometheus skips the first seen sample value per each time series.
If you need taking into account the first sample per time series, then take a look at total.
total_prometheus is not affected by counter resets -
it continues to increase monotonically with respect to the previous value.
The counters are most often reset when the application is restarted.
Aggregating irregular and sporadic metrics (received from Lambdas or Cloud Functions) can be controlled via staleness_interval option.
See also total, increase and increase_prometheus.
unique_samples
unique_samples counts the number of unique sample values over the given interval.
unique_samples makes sense only for aggregating gauges.
The results of unique_samples is equal to the following MetricsQL query:
count(count_values_over_time(some_metric[interval]))
See also sum_samples and count_series.
quantiles
quantiles(phi1, ..., phiN) returns percentiles for the given phi*
over the input sample values on the given interval.
phi must be in the range [0..1], where 0 means 0th percentile, while 1 means 100th percentile.
quantiles(...) makes sense only for aggregating gauges.
The results of quantiles(phi1, ..., phiN) is equal to the following MetricsQL query:
histogram_quantiles("quantile", phi1, ..., phiN, sum(histogram_over_time(some_metric[interval])) by (vmrange))
See also histogram_bucket, min, max and avg.
Aggregating by labels
All the labels for the input metrics are preserved by default in the output metrics. For example,
the input metric foo{app="bar",instance="host1"} results to the output metric foo:1m_sum_samples{app="bar",instance="host1"}
when the following stream aggregation config is used:
- interval: 1m
  outputs: [sum_samples]
The input labels can be removed via without list specified in the config. For example, the following config
removes the instance label from output metrics by summing input samples across all the instances:
- interval: 1m
  without: [instance]
  outputs: [sum_samples]
In this case the foo{app="bar",instance="..."} input metrics are transformed into foo:1m_without_instance_sum_samples{app="bar"}
output metric according to output metric naming.
It is possible specifying the exact list of labels in the output metrics via by list.
For example, the following config sums input samples by the app label:
- interval: 1m
  by: [app]
  outputs: [sum_samples]
In this case the foo{app="bar",instance="..."} input metrics are transformed into foo:1m_by_app_sum_samples{app="bar"}
output metric according to output metric naming.
The labels used in by and without lists can be modified via input_relabel_configs section - see these docs.
See also aggregation outputs.
Stream aggregation config
Below is the format for stream aggregation config file, which may be referred via -remoteWrite.streamAggr.config command-line flag
at vmagent or via -streamAggr.config command-line flag
at single-node VictoriaMetrics:
  # match is an optional filter for incoming samples to aggregate.
  # It can contain arbitrary Prometheus series selector
  # according to https://docs.victoriametrics.com/keyconcepts/#filtering .
  # If match isn't set, then all the incoming samples are aggregated.
  #
  # match also can contain a list of series selectors. Then the incoming samples are aggregated
  # if they match at least a single series selector.
  #
- match: 'http_request_duration_seconds_bucket{env=~"prod|staging"}'

  # interval is the interval for the aggregation.
  # The aggregated stats is sent to remote storage once per interval.
  #
  interval: 1m

  # dedup_interval is an optional interval for de-duplication of input samples before the aggregation.
  # Samples are de-duplicated on a per-series basis. See https://docs.victoriametrics.com/keyconcepts/#time-series
  # and https://docs.victoriametrics.com/#deduplication
  # The deduplication is performed after input_relabel_configs relabeling is applied.
  # By default the deduplication is disabled unless -remoteWrite.streamAggr.dedupInterval or -streamAggr.dedupInterval
  # command-line flags are set.
  #
  # dedup_interval: 30s

  # staleness_interval is an optional interval for resetting the per-series state if no new samples
  # are received during this interval for the following outputs:
  # - total
  # - total_prometheus
  # - increase
  # - increase_prometheus
  # - histogram_bucket
  # See https://docs.victoriametrics.com/stream-aggregation/#staleness for more details.
  #
  # staleness_interval: 2m

  # no_align_flush_to_interval disables aligning of flush times for the aggregated data to multiples of interval.
  # By default flush times for the aggregated data is aligned to multiples of interval.
  # For example:
  # - if `interval: 1m` is set, then flushes happen at the end of every minute,
  # - if `interval: 1h` is set, then flushes happen at the end of every hour
  #
  # no_align_flush_to_interval: false

  # flush_on_shutdown instructs to flush aggregated data to the storage on the first and the last intervals
  # during vmagent starts, restarts or configuration reloads.
  # Incomplete aggregated data isn't flushed to the storage by default, since it is usually confusing.
  #
  # flush_on_shutdown: false

  # without is an optional list of labels, which must be removed from the output aggregation.
  # See https://docs.victoriametrics.com/stream-aggregation/#aggregating-by-labels
  #
  without: [instance]

  # by is an optional list of labels, which must be preserved in the output aggregation.
  # See https://docs.victoriametrics.com/stream-aggregation/#aggregating-by-labels
  #
  # by: [job, vmrange]

  # outputs is the list of aggregations to perform on the input data.
  # See https://docs.victoriametrics.com/stream-aggregation/#aggregation-outputs
  #
  outputs: [total]

  # keep_metric_names instructs keeping the original metric names for the aggregated samples.
  # This option can be set only if outputs list contains only a single output.
  # By default a special suffix is added to original metric names in the aggregated samples.
  # See https://docs.victoriametrics.com/stream-aggregation/#output-metric-names
  #
  # keep_metric_names: false

  # ignore_old_samples instructs ignoring input samples with old timestamps outside the current aggregation interval.
  # See also -streamAggr.ignoreOldSamples command-line flag.
  #
  # ignore_old_samples: false

  # drop_input_labels instructs dropping the given labels from input samples.
  # The labels' dropping is performed before input_relabel_configs are applied.
  # This also means that the labels are dropped before de-duplication ( https://docs.victoriametrics.com/stream-aggregation/#deduplication )
  # and stream aggregation.
  #
  # drop_input_labels: [replica, availability_zone]

  # input_relabel_configs is an optional relabeling rules,
  # which are applied to the incoming samples after they pass the match filter
  # and before being aggregated.
  # See https://docs.victoriametrics.com/stream-aggregation/#relabeling
  #
  input_relabel_configs:
  - target_label: vmaggr
    replacement: before

  # output_relabel_configs is an optional relabeling rules,
  # which are applied to the aggregated output metrics.
  #
  output_relabel_configs:
  - target_label: vmaggr
    replacement: after
The file can contain multiple aggregation configs. The aggregation is performed independently per each specified config entry.
Configuration update
vmagent and single-node VictoriaMetrics
support the following approaches for hot reloading stream aggregation configs from -remoteWrite.streamAggr.config and -streamAggr.config:
-
By sending
SIGHUPsignal tovmagentorvictoria-metricsprocess:kill -SIGHUP `pidof vmagent` -
By sending HTTP request to
/-/reloadendpoint (e.g.http://vmagent:8429/-/reloador `http://victoria-metrics:8428/-/reload).
Troubleshooting
- Unexpected spikes for
totalorincreaseoutputs. - Lower than expected values for
total_prometheusandincrease_prometheusoutputs. - High memory usage and CPU usage.
- Unexpected results in vmagent cluster mode.
Staleness
The following outputs track the last seen per-series values in order to properly calculate output values:
The last seen per-series value is dropped if no new samples are received for the given time series during two consecutive aggregation
intervals specified in stream aggregation config via interval option.
If a new sample for the existing time series is received after that, then it is treated as the first sample for a new time series.
This may lead to the following issues:
- Lower than expected results for total_prometheus and increase_prometheus outputs, since they ignore the first sample in a new time series.
- Unexpected spikes for total and increase outputs, since they assume that new time series start from 0.
These issues can be be fixed in the following ways:
- By increasing the
intervaloption at stream aggregation config, so it covers the expected delays in data ingestion pipelines. - By specifying the
staleness_intervaloption at stream aggregation config, so it covers the expected delays in data ingestion pipelines. By default thestaleness_intervalequals to2 x interval.
High resource usage
The following solutions can help reducing memory usage and CPU usage durting streaming aggregation:
- To use more specific
matchfilters at streaming aggregation config, so only the really needed raw samples are aggregated. - To increase aggregation interval by specifying bigger duration for the
intervaloption at streaming aggregation config. - To generate lower number of output time series by using less specific
bylist or more specificwithoutlist. - To drop unneeded long labels in input samples via input_relabel_configs.
Cluster mode
If you use vmagent in cluster mode for streaming aggregation
then be careful when using by or without options or when modfying sample labels
via relabeling, since incorrect usage may result in duplicates and data collision.
For example, if more than one vmagent instance calculates increase for http_requests_total metric
with by: [path] option, then all the vmagent instances will aggregate samples to the same set of time series with different path labels.
The proper fix would be adding an unique label for all the output samples
produced by each vmagent, so they are aggregated into distinct sets of time series.
These time series then can be aggregated later as needed during querying.
If vmagent instances run in Docker or Kubernetes, then you can refer POD_NAME or HOSTNAME environment variables
as an unique label value per each vmagent via -remoteWrite.label=vmagent=%{HOSTNAME} command-line flag.
See these docs on how to refer environment variables in VictoriaMetrics components.