Regression was introduced at 564e6ea024
after implementing:
https://github.com/VictoriaMetrics/VictoriaMetrics/issues/6928

ctx.Labels array could be incorrectly updated and changes to it after
relabeling rules can be lost.
E.g. ctx.Labels passed to WriteDataPoint function as slice copy, but
results of relabeling only changed an actual slice at ctx.Labels.

This commit replaces implicit relabeling call with explicit
`TryPrepareLabels` function.
It also reduces code diffs with cluster version and adds integration tests

 related issue:
https://github.com/VictoriaMetrics/VictoriaMetrics/issues/7865

---------

Signed-off-by: f41gh7 <nik@victoriametrics.com>
Co-authored-by: Roman Khavronenko <roman@victoriametrics.com>
While at at, allow passing an array of string values per each JSON entry at extra_filters and extra_stream_filters.
For example, `extra_filters={"foo":["bar","baz"]}` is converted into `foo:in("bar", "baz")` extra filter,
while `extra_stream_fitlers={"foo":["bar","baz"]}` is converted into `{foo=~"bar|baz"}` extra filter.

This should simplify creating faceted search when multiple values per a single log field must be selected.
This is needed for https://github.com/VictoriaMetrics/VictoriaMetrics/issues/7365#issuecomment-2447964259

Updates https://github.com/VictoriaMetrics/VictoriaMetrics/issues/5542
Such log fields do not give any useful information during logs' exploration.
They just clutter the output of the `facets` pipe. So it is better to drop such fields by default.

If these fields are needed, then `keep_const_fields` option can be added to `facets` pipe.
This PR fixes#5796. See the points 6 and 7 in `Steps to reproduce`:
> Now let's set time to only 5ms past the timestamp of the first point,
since even 199ms worked for the second point. Surprise, the point isn't
returned 💥:
>
> ```curl -s $VMQURL -d 'query=series1' -d 'time=1707123456705' -d
'step=1ms' | grep 10 # nothing!```
>
> But, 4ms works: 🤨🤔
>
> ```curl -s $VMQURL -d 'query=series1' -d 'time=1707123456704' -d
'step=1ms' | grep 10 # found```
This happens so because the actual step becomes 5ms due to jitter being
applied. THe fix is to do not apply jitter if scrape interval was not
detected (the case when vmstorage returns only one result). In this case
the scrape interval is set to `5m+step`.
An integration test has been added to check the steps to reproduce and
then to confirm that fix works. Note that the cluster tests are
currently disabled because the fix is not in cluster branch yet.
The following checks are **mandatory**:
- [x] My change adheres [VictoriaMetrics contributing
guidelines](https://docs.victoriametrics.com/contributing/).
---------
Signed-off-by: Artem Fetishev <rtm@victoriametrics.com>
Previously after configuration reload call `externalURL` templaing function defined at external templates could be lost. Since it was added only at initial `Load` call and never copied during template reload process.
External templates for vmalert could be defined via `-rule.templates` flag.

 This commit properly reload external templates. It's no longer copies mutated templates and instead fully reloads it each time if there is any changes.
Previously cluster with the following vmselect configuration:

./bin/vmselect
  -storageNode=gr1/:8211,gr1/:8212
  -storageNode=gr2/:8213,gr2/:8214
  -search.skipSlowReplicas=true
  -globalReplicationFactor=2

Here we have two vmstorage groups and -globalReplicationFactor=2, which effectively means that "every ingested sample is replicated across multiple vmstorage groups". Hence, gr1 and gr2 contain identical data set. And when we set -search.skipSlowReplicas=true it is expected vmselect should return result as soon as at least one storage group returned the full result.
In current state, -search.skipSlowReplicas is ignored on the storage group level. It is only respected within the group (with -replicationFactor flag).


   This commit fixes global replication for skipSlowReplicas.

 To ensure that the fix works and does not break
anything replication tests have been added. For checking the fix for
skipping slow replicas see `testGroupSkipSlowReplicas()`.

To emulate storage groups, the integration test creates a cluster with
multilevel vminsert. The L1 inserts are group-level inserts, each writes
to its own group of vmstorages. The L2 vminsert is a global vminsert
that writes replicated to the L1 vminserts.

To enable multilevel inserts changes in apptest framework and
`lib/ingestserver/clusternative/server.go` were necessary.

related issue:
https://github.com/VictoriaMetrics/VictoriaMetrics/issues/6924

---------

Signed-off-by: Artem Fetishev <rtm@victoriametrics.com>
See https://alpinelinux.org/posts/Alpine-3.21.0-released.html

### Describe Your Changes

Please provide a brief description of the changes you made. Be as
specific as possible to help others understand the purpose and impact of
your modifications.

### Checklist

The following checks are **mandatory**:

- [ ] My change adheres [VictoriaMetrics contributing
guidelines](https://docs.victoriametrics.com/contributing/).

Signed-off-by: hagen1778 <roman@victoriametrics.com>
(cherry picked from commit 87c1b2de6f)
Previously, time series with labels exceeding the configured limits were truncated and written to storage, potentially causing data inconsistency. This could lead to collisions between time series and make it difficult to identify the source due to truncated labels.

This commit changes the behavior:
*  Such time series are now rejected outright.
* Rejected time series are logged to stdout, and corresponding counters are incremented.
* removes `vm_too_long_label_values_total`, `vm_too_long_label_names_total`, `vm_metrics_with_dropped_labels_total` metrics.
* adds new values `[too_many_labels,too_long_label_name,too_long_label_value]`  to `reason` label of the `vm_rows_ignored_total` metric name

related issues:
- https://github.com/VictoriaMetrics/VictoriaMetrics/issues/6928
- https://github.com/VictoriaMetrics/VictoriaMetrics/issues/7661
Previous commit b09272ccac added regression, which could lead to the template
global state overwrites.

 The issue related to the mechanism how `vmalert` inherits templates. It has global templates, that could be changed via `rule.templates` flag. And local templates defined per labels/annotations for rules and groups.

 During labels/annotations templating state could be changed via `define` syntax.

 This commit restores previous behavior with `Clone` call for templates before templating labels/annotations.

 Affected releases:
- 1.106.1
- v1.102.7
- v1.97.12

 Related issue:
https://github.com/VictoriaMetrics/VictoriaMetrics/issues/6894
This commit adds ability to launch vmauth without configuration file.
Which is possible use case for operator based installations.

  Operator provides global resource `VMAuth` and allows to create
`VMUser` objects for it. Eventually operator creates configuration for
`VMAuth` based on user defined selectors for `VMUser`.

  Since there is no direct relations between
those objects. And any object could be created in on-demand by
Kubernetes users. It's required to be able to start `vmauth` with empty
auth config file.

Related issue:
https://github.com/VictoriaMetrics/VictoriaMetrics/issues/6467
The max_value_len query arg allows controlling the maximum length of values
per every log field. If the length is exceeded, then the log field is dropped
from the results, since it contains incomplete (misleading) set of most frequently seen field values.

(cherry picked from commit 48540ac409)
This endpoint returns the most frequent values per each field seen in the selected logs.
This endpoint is going to be used by VictoriaLogs web UI for faceted search.

(cherry picked from commit 740548ccfc)
Requests processed by built-in HTTP server has the [origin
form](https://datatracker.ietf.org/doc/html/rfc7230#section-5.3) rather
than the absolute form.

 So in[Request.URL](https://pkg.go.dev/net/http#Request), fields other than
Path and RawQuery will be empty.
> 	// For server requests, the URL is parsed from the URI
> 	// supplied on the Request-Line as stored in RequestURI.  For
> 	// most requests, fields other than Path and RawQuery will be
> 	// empty. (See RFC 7230, Section 5.3)

 Using `request.Host` field instead to match `src_hosts` fixes issue and allows to route requests properly.

An addition It allows user to route requests with customized `Host` header.
The storage isn't designed to work efficiently with logs containing too many log fields.
It is better to emit a warning to the user and ignore such logs instead of trying to store them.
This will allow fixing the issue by the user ASAP, and won't lead to excess resource usage
at VictoriaLogs side, such as RAM, CPU, disk IO and disk space.

While at it, ignore too long logs with the size exceeding the maximum block size during data ingestion.
This should prevent from possible issues when dealing with such long logs if they were stored in the storage.
Emit a warning in this case, so the user could identify and fix the issue ASAP.

This is a follow-up for 22e6385f56

Updates https://github.com/VictoriaMetrics/VictoriaMetrics/issues/7568
Previously too long line in Elasticsearch bulk import protocol resulted in clsoing
the client stream and ignoring the rest of log messages in the stream.

Now only the too long message is ignored properly, while the rest of log messages
are read successfully.

This is a follow-up for 61e7c77ce25967269192ed2e201f67d8c48b972e
Previously vl_rows_ingested_total metric was tracked individually per each supported data ingestion protocols.
It is better from maintainability PoV tracking this metric consistently in a single place - at logMessageProcessor.AddRow() function
in the same way as vl_bytes_ingested_total metric is tracked.

This is a follow-up for 50bfa689c9
This metric tracks an approximate amounts of bytes processed when parsing the ingested logs.
The metric is exposed individually per every supported data ingestion protocol. The protocol name
is exposed via "type" label in order to be consistent with vl_rows_ingested_total metric.

Thanks to @tenmozes for the initial idea and implementation at https://github.com/VictoriaMetrics/VictoriaMetrics/pull/7682

While at it, remove the unneeded "format" label from vl_rows_ingested_total metric.
The "type" label must be enough for encoding the data ingestion format.
Comment broken tests for remote_read integration test.
 Prometheus broke library compatibility and it's required to rewrite tests.
 Also, test structure and format should be revisited and improved according to our test code style.

Signed-off-by: f41gh7 <nik@victoriametrics.com>
Removes global defaultAuthToken, since it's no longer needed.
It was added as fallback for 'remoteWrite.multitenantURL' feature.
This feature was deprecated at v1.102 version and removed.

 Updates newRemoteWriteCtxs function, it shouldn't accept auth.Token no longer.
This was also a part of remove feature.

Signed-off-by: f41gh7 <nik@victoriametrics.com>
Previously, vmagent produced parsing error for 'multitenant' auth token
value for the cases:
* data ingestion with enableMultitentEndpoints
* data scrapping at promscrape

 It's inconsistent to the other VictoriaMetrics components.
Since 'multitenant' is well-known token value for multitenancy via
labels. And vmagent is intended to be compatible with vminsert ingestion
endpoints.

 This commit replaces NewToken with NewTokenPossibleMultitenant function
for token parsing. It allows to use multitenant value for it. And it
makes token values consistent for the all components.

Related issue:
https://github.com/VictoriaMetrics/VictoriaMetrics/issues/7694
Previously, there was no option to replace value of `X-Forwarded-For`
HTTP Header. It was only possible to completely remove it. It's not good
solution, since backend may require this information. But using direct
value of this header is insecure. And requires complex knowledge of
infrastruce at backend side (see spoofing X-Forwarded-For articles).

This commit adds new flag, that replaces content of `X-Forwarded-For`
HTTP Header value with current `RemoteAddress` of client that send
request.
It should be used if `vmauth` is directly attached to the internet.

 Related issue:
https://github.com/VictoriaMetrics/VictoriaMetrics/issues/6883

---------

Signed-off-by: f41gh7 <nik@victoriametrics.com>
### Describe Your Changes

- Fixes the handling of the `showLegend` flag.
- Fixes the handling of `alias`.
- Adds support for alias templates, allowing dynamic substitutions like
`{{label_name}}`.

Related issue:
https://github.com/VictoriaMetrics/VictoriaMetrics/issues/7565
### Describe Your Changes

- **Memory Optimization**: Reduced memory consumption on the "Group" and
"JSON" tabs by approximately 30%.

- **Table Pagination**: Added pagination to the "Table" view with an
option to select the number of rows displayed (from 10 to 1000 items per
page, with a default of 1000). This change significantly reduced memory
usage by approximately 75%.

Related to #7185

### Checklist

The following checks are **mandatory**:

- [ ] My change adheres [VictoriaMetrics contributing
guidelines](https://docs.victoriametrics.com/contributing/).

---------

Co-authored-by: Roman Khavronenko <roman@victoriametrics.com>
doing similar changes for both vmagent and vminsert (like one in
https://github.com/VictoriaMetrics/VictoriaMetrics/pull/7399) ends up
with almost same implementations for each of packages instead of having
this shared code in one place. one of the reasons is the same Timeseries
and Labels structure from different prompb and prompbmarshal packages.
My proposal is to use structures from prompb package only to
marshal/unmarshal sent/received data, but for internal transformations
use only structures from prompbmarshal package

Another example, where it already can help to simplify code is streaming
aggregation pipeline for vmsingle (now it first marshals
prompb.Timeseries to storage.MetricRow and then if streaming aggregation
or deduplication is enabled it unmarshals all the series back but to
prompbmarshal.Timeseries)

The following checks are **mandatory**:

- [ ] My change adheres [VictoriaMetrics contributing
guidelines](https://docs.victoriametrics.com/contributing/).
Additional info from the dump can be used to debug rotuing rules.

https://pkg.go.dev/net/http/httputil#DumpRequest

### Describe Your Changes

Please provide a brief description of the changes you made. Be as
specific as possible to help others understand the purpose and impact of
your modifications.

### Checklist

The following checks are **mandatory**:

- [ ] My change adheres [VictoriaMetrics contributing
guidelines](https://docs.victoriametrics.com/contributing/).

---------

Signed-off-by: hagen1778 <roman@victoriametrics.com>
Previously multitenant cache was inited before flag.Parse call. It
didn't allow to change cache expiration value and default value was
always used.

 This commit adds cache init at the first time cache was called.

 Also this commit adds small cache improvements:
* chore for cleanup cache, it now uses common pattern for in-place items
filtering
* fail cache request fast if item is already expired


---------
Signed-off-by: f41gh7 <nik@victoriametrics.com>
Co-authored-by: Roman Khavronenko <roman@victoriametrics.com>
This is a follow-up after 3120dc2

- Consistently use key for rollupCache in multitenant mode cache keys use different authTokens. Previously it could lead to panic in rare cases when cache state was inconsistent.
- Do not share `err` variable across goroutines for `processBlock` function. It could lead to data races.

Related issue https://github.com/VictoriaMetrics/VictoriaMetrics/issues/7549
---------
Signed-off-by: Andrei Baidarov <abaidarov@yandex.ru>
Co-authored-by: f41gh7 <nik@victoriametrics.com>
Previously, when the alert got resolved shortly before the vmalert
process shuts down, this could result in false alerts.

This change switches vmalert to use MetricsQL function during alerts state restore, which makes it
incompatible for state restoration with PromQL.

---------

Co-authored-by: Roman Khavronenko <roman@victoriametrics.com>
### Describe Your Changes

1. **Add new `Raw Query` tab**
A new `Raw Query` tab has been added to the
[vmui](https://docs.victoriametrics.com/#vmui) interface for displaying
raw data. The tab uses the `/api/v1/export` API endpoint. Related issue:
[#7024](https://github.com/VictoriaMetrics/VictoriaMetrics/issues/7024)


2. **Fix rendering of isolated points on the graph**
Previously, isolated points (not connected to other points on the left
or right) were not visible on the graph. Now, they are rendered
correctly.


### Checklist

The following checks are **mandatory**:

- [ ] My change adheres [VictoriaMetrics contributing
guidelines](https://docs.victoriametrics.com/contributing/).

---------

Co-authored-by: Roman Khavronenko <roman@victoriametrics.com>
Previously, for `^` aka pow function calls, VictoriaMetrics returned `1`
if left arg was Nan. For example, given query=`(hour()==2)^1` returns 1
for NaN produced by hour() == 2 function. It added additional non-exist
datapoints to the timeseries.

This commit port bugfix from `metricql` package and adds test for it.
Now, VictoriaMetrics
correctly returns `NaN` for such cases.

Related issue:
https://github.com/VictoriaMetrics/VictoriaMetrics/issues/7359

Signed-off-by: f41gh7 <nik@victoriametrics.com>
(cherry picked from commit bb399518db)
This commit fixes panic for multitenant requests and empty storage node responses for tenants api.

 It also optimizes `populateSqTenantTokensIfNeeded` function calls, by making it only once for query request. Previously it was incorrectly called multiple times per each storage node request.

Related issue:
https://github.com/VictoriaMetrics/VictoriaMetrics/issues/7549
---------
Signed-off-by: f41gh7 <nik@victoriametrics.com>
Co-authored-by: f41gh7 <nik@victoriametrics.com>
1. Avoid storing the last evaluation results outside of rules, check for
stale time series as soon as possible;
2. remove duplicated template `Clone()`.

This pull request is primarily reducing memory usage when rules produce
large volumes of results, as seen in
https://github.com/VictoriaMetrics/VictoriaMetrics/issues/6894.
The CPU time spent on garbage collection remains high and may be
addressed in a separate PR.
The following user-level options must be unconditionally inherited by url_map, since this is what most users expect:

- retry_status_codes
- load_balancing_policy
- drop_src_path_prefix_parts
- discover_backend_ips

Updates https://github.com/VictoriaMetrics/VictoriaMetrics/issues/7519
The fix at a0a154511a looks too complicated and fragile:

- It moves buMin initialization to the place, which is far from its usage.
- It embeds unclear logic on selecting the proper buMin if it is broken,
  into unrelated loop.

The actual fix must be more clear:

$ git diff 95acca6b52 -- app/vmauth/

-               if n := bu.concurrentRequests.Load(); n < minRequests {
+               if n := bu.concurrentRequests.Load(); n < minRequests || buMin.isBroken() {

This should simplify further maintenance of this code.

Updates https://github.com/VictoriaMetrics/VictoriaMetrics/pull/7489
Updates https://github.com/VictoriaMetrics/VictoriaMetrics/issues/3061
By default the delay equals to 1 second.

While at it, document refresh_interval query arg at /select/logsql/tail endpoint.

Thanks to @Fusl for the idea and the initial implementation at https://github.com/VictoriaMetrics/VictoriaMetrics/pull/7428

(cherry picked from commit a44787372f)
This eliminates possible bugs related to forgotten Query.Optimize() calls.

This also allows removing optimize() function from pipe interface.

While at it, drop filterNoop inside filterAnd.

(cherry picked from commit 66b2987f49)
Previously, vmauth could have pick `buMin` as least loaded backend
without checking its status. In result, vmauth could have respond to the
user with an error even if there were healthy backends. That could
happen if healthy backends already had non-zero amount of concurrent
requests executing at the moment of least-loaded backend choosing logic.

Steps to reproduce:
1. Setup vmauth with two backends: healthy and non-healthy
2. Execute a bunch of concurrent requests against vmauth (i.e. Grafana
dash reload)
3. Observe that some requests will fail with message that all backends
are unavailable

Addresses https://github.com/VictoriaMetrics/VictoriaMetrics/issues/3061
---
Signed-off-by: hagen1778 <roman@victoriametrics.com>
(cherry picked from commit a0a154511a)
### Describe Your Changes

add sorting of logs by groups and within each group by time in desc
order. See #7184 and #7045

### Checklist

The following checks are **mandatory**:

- [ ] My change adheres [VictoriaMetrics contributing
guidelines](https://docs.victoriametrics.com/contributing/).

Co-authored-by: Aliaksandr Valialkin <valyala@victoriametrics.com>
(cherry picked from commit 1e1952acf5)
Previously it incorrectly applied xFilesFactor, if it's value equal to 0.
This commit properly handles this case and returns result according to
the graphite documentation:
`xFilesFactor follows the same semantics as in Whisper storage schemas. Setting it to 0 (the default) means that only a single value in the series needs to be non-null for it to be considered non-empty, setting it to 1 means that all values in the series must be non-null. A setting of 0.5 means that at least half the values in the series must be non-null.`
Signed-off-by: f41gh7 <nik@victoriametrics.com>
Co-authored-by: Evgeniy Negriy <einegriy@avito.ru>
(cherry picked from commit d27dfac5c6)
Loki protocol supports optional `metadata` object for each ingested line. It's added as 3rd field at the (ts,msg,metadata) tuple. Previously,  loki request json parsers rejected log line if tuple size != 2.

This commit allows optional tuple field. It parses it as json object and adds it as log metadata fields to the  log message stream.

related issue:
https://github.com/VictoriaMetrics/VictoriaMetrics/issues/7431

---------
Co-authored-by: f41gh7 <nik@victoriametrics.com>

(cherry picked from commit 3aeb1b96a2)
### Describe Your Changes

I don't like this solution, but it works. Other possible solutions
described in an issue

fixes https://github.com/VictoriaMetrics/VictoriaMetrics/issues/7068

### Checklist

The following checks are **mandatory**:

- [ ] My change adheres [VictoriaMetrics contributing
guidelines](https://docs.victoriametrics.com/contributing/).

---------

Signed-off-by: hagen1778 <roman@victoriametrics.com>
Co-authored-by: hagen1778 <roman@victoriametrics.com>
(cherry picked from commit a88f896b43)
### Describe Your Changes

Fix https://github.com/VictoriaMetrics/VictoriaMetrics/issues/7301

When querying with condition like `WHERE a=1` (looking for series A),
InfluxDB can return data with the tag `a=1` (series A) and data with the
tag `a=1,b=1` (series B).

However, series B is will be queried later and it's data should not be
combined into series A's data.

This PR filter those series that are not identical to the original query
condition.

For table `example`:
```
// time                           host    region  value
// ----                           ----    ------  -----
// 2024-10-25T02:12:13.469720983Z serverA us_west 0.64
// 2024-10-25T02:12:21.832755213Z serverA us_west 0.75
// 2024-10-25T02:12:32.351876479Z serverA         0.88
// 2024-10-25T02:12:37.766320484Z serverA         0.95
```

The query for series A (`example_value{host="serverA"}`) and result will
be:
```SQL
SELECT * FROM example WHERE host = "serverA"
```
```json
{
	"results": [{
		"statement_id": 0,
		"series": [{
			"name": "cpu",
			"columns": ["time", "host", "region", "value"],
			"values": [
				["2024-10-25T02:12:13.469720983Z", "serverA", "us_west", 0.64],
				["2024-10-25T02:12:21.832755213Z", "serverA", "us_west", 0.75],
				["2024-10-25T02:12:32.351876479Z", "serverA", null, 0.88],
				["2024-10-25T02:12:37.766320484Z", "serverA", null, 0.95]
			]
		}]
	}]
}
```

We need to abandon `values[0]` and `values[1]` because the value of
**unwanted** column `region` is not null.

As for series B (`example_value{host="serverA", region="us_west"}`), no
change needed since the query filter out unwanted rows already.

### Note
This is a draft PR for verifying the fix.

### Checklist

The following checks are **mandatory**:

- [x] My change adheres [VictoriaMetrics contributing
guidelines](https://docs.victoriametrics.com/contributing/).

---------

Signed-off-by: hagen1778 <roman@victoriametrics.com>
Co-authored-by: hagen1778 <roman@victoriametrics.com>
(cherry picked from commit f16a58f14c)
This commit adds the following changes:

- Added support to push datadog logs with examples of how to ingest data
using Vector and Fluentbit
- Updated VictoriaLogs examples directory structure to have single
container image for victorialogs, agent (fluentbit, vector, etc) but
multiple configurations for different protocols

Related issue https://github.com/VictoriaMetrics/VictoriaMetrics/issues/6632

(cherry picked from commit e0930687f1)
In this case the _msg field is set to the value specified in the -defaultMsgValue command-line flag.

This should simplify first-time migration to VictoriaLogs from other systems.

(cherry picked from commit 16ee470da6)
This msy be useful when ingesting logs from different sources, which store the log message in different fields.
For example, `_msg_field=message,event.data,some_field` will get log message from the first non-empty field:
`message`, `event.data` and `some_field`.

(cherry picked from commit ed73f8350b)
### Describe Your Changes

Fixes issues with incorrect updating of query and limit fields, and
resolves the problem where the display tab resets.

Related issue: #7279 and #7290

### Checklist

The following checks are **mandatory**:

- [ ] My change adheres [VictoriaMetrics contributing
guidelines](https://docs.victoriametrics.com/contributing/).

---------

Signed-off-by: hagen1778 <roman@victoriametrics.com>
Co-authored-by: Zakhar Bessarab <z.bessarab@victoriametrics.com>
Related issue:
https://github.com/VictoriaMetrics/VictoriaMetrics/issues/7182
- add a separate index cache for searches which might read through large
amounts of random entries. Primary use-case for this is retention and
downsampling filters, when applying filters background merge needs to
fetch large amount of random entries which pollutes an index cache.
Using different caches allows to reduce effect on memory usage and cache
efficiency of the main cache while still having high cache hit rate. A
separate cache size is 5% of allowed memory.
- reduce size of indexdb/dataBlocks cache in order to free memory for
new sparse cache. Reduced size by 5% and moved this to a separate cache.
- add a separate metricName search which does not cache metric names -
this is needed in order to allow disabling metric name caching when
applying downsampling/retention filters. Applying filters during
background merge accesses random entries, this fills up cache and does
not provide an actual improvement due to random access nature.
Merge performance and memory usage stats before and after the change:
- before

- after

---------
Signed-off-by: Zakhar Bessarab <z.bessarab@victoriametrics.com>
(cherry picked from commit 837d0d136d)
Fixes https://github.com/VictoriaMetrics/VictoriaMetrics/issues/7309

### Describe Your Changes

Please provide a brief description of the changes you made. Be as
specific as possible to help others understand the purpose and impact of
your modifications.

### Checklist

The following checks are **mandatory**:

- [ ] My change adheres [VictoriaMetrics contributing
guidelines](https://docs.victoriametrics.com/contributing/).

---------

Signed-off-by: hagen1778 <roman@victoriametrics.com>
Co-authored-by: hagen1778 <roman@victoriametrics.com>

(cherry picked from commit 5fecb77f69)
Signed-off-by: hagen1778 <roman@victoriametrics.com>
Auto-adjust `-remoteWrite.concurrency` cmd-line flags with the number of
available CPU cores in the same way as vmagent does. With this change
the default behavior of vmalert in high-loaded installation should
become more resilient. This change also reduces
`-remoteWrite.flushInterval` from `5s` to `2s` to provide better data
freshness.


---------
Signed-off-by: hagen1778 <roman@victoriametrics.com>
Co-authored-by: Nikolay <nik@victoriametrics.com>
This commit properly adds `group_name` and `file` fields for recording rules web api response   at `/api/v1/rules`.
Previously these fields were blank.

Related issue https://github.com/victoriaMetrics/victoriaMetrics/issues/7297

Signed-off-by: Antoine Deschênes <antoine.deschenes@linux.com>
### Describe Your Changes

Add support for
https://github.com/VictoriaMetrics/VictoriaMetrics/issues/6930

Calculate `-search.maxUniqueTimeseries` by
`-search.maxConcurrentRequests` and remaining memory if it's **not set**
or **less equal than 0**.

The remaining memory is affected by `-memory.allowedPercent`,
`-memory.allowedBytes` and cgroup memory limit.
### Checklist

The following checks are **mandatory**:

- [x] My change adheres [VictoriaMetrics contributing
guidelines](https://docs.victoriametrics.com/contributing/).

---------

Signed-off-by: hagen1778 <roman@victoriametrics.com>
Co-authored-by: Roman Khavronenko <roman@victoriametrics.com>
Group
[sleeps](daa7183749/app/vmalert/rule/group.go (L320))
random duration before start the evaluation, and during the sleep,
`g.updateCh <- new` will be blocked since there is no `<-g.updateCh`
waiting.

---------

Signed-off-by: hagen1778 <roman@victoriametrics.com>
Co-authored-by: hagen1778 <roman@victoriametrics.com>

(cherry picked from commit c4fe23794a)
Signed-off-by: hagen1778 <roman@victoriametrics.com>
### Describe Your Changes
**Added ability to hide the hits chart**
- Users can now hide or show the hits chart by clicking the "eye" icon
located in the upper-right corner of the chart.
- When the chart is hidden, it will stop sending requests to
`/select/logsql/hits`.
- Upon displaying the chart again, it will automatically refresh. If a
relative time range is set, the chart will update according to the time
period of the logs currently being displayed.
**Hits chart visible:**
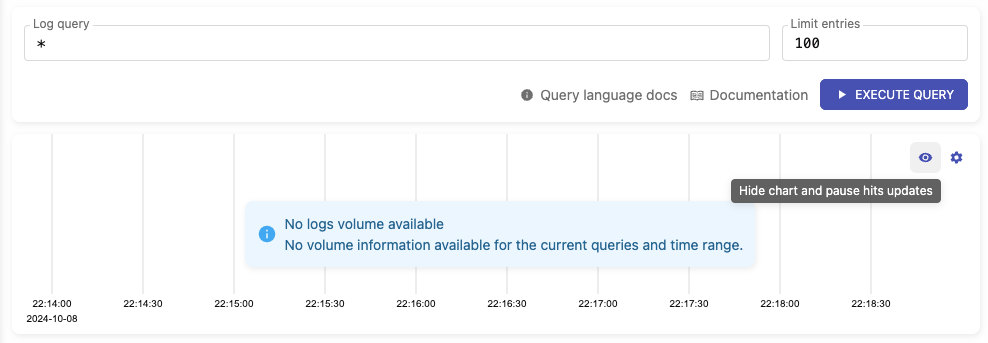
**Hits chart hidden:**

Related issue: #7117
### Checklist
The following checks are **mandatory**:
- [ ] My change adheres [VictoriaMetrics contributing
guidelines](https://docs.victoriametrics.com/contributing/).
Co-authored-by: Aliaksandr Valialkin <valyala@victoriametrics.com>
(cherry picked from commit 423df09d7d)
### Describe Your Changes

Fixed the display of hits chart in VictoriaLogs.
See #7133

### Checklist

The following checks are **mandatory**:

- [ ] My change adheres [VictoriaMetrics contributing
guidelines](https://docs.victoriametrics.com/contributing/).

(cherry picked from commit 36a86c3aaf)
The purpose of this change is to reduce confusion between using
`flag.Duration` and `flagutils.Duration`. The reason is that
`flagutils.Duration` was mistakenly used for cases that required `m`
support. See
ab0d31a7b0

The change in name should clearly indicate the purpose of this data
type.

Please provide a brief description of the changes you made. Be as
specific as possible to help others understand the purpose and impact of
your modifications.

The following checks are **mandatory**:

- [ ] My change adheres [VictoriaMetrics contributing
guidelines](https://docs.victoriametrics.com/contributing/).

Signed-off-by: hagen1778 <roman@victoriametrics.com>
Previously unit `m` is not correctly supported.

---------

Signed-off-by: hagen1778 <roman@victoriametrics.com>
Co-authored-by: hagen1778 <roman@victoriametrics.com>
### Describe Your Changes

Please provide a brief description of the changes you made. Be as
specific as possible to help others understand the purpose and impact of
your modifications.

### Checklist

The following checks are **mandatory**:

- [ ] My change adheres [VictoriaMetrics contributing
guidelines](https://docs.victoriametrics.com/contributing/).

Signed-off-by: hagen1778 <roman@victoriametrics.com>
Previously it was incorrectly used append for pre-allocated slice of labels.

This commit fixes slice append by allocating zero length slice with needed capacity.

---------

Co-authored-by: Nikolay <nik@victoriametrics.com>
### Describe Your Changes

Fix `Alert` component to prevent it from overflowing the screen when
displaying long messages.

Related issue: #7207

### Checklist

The following checks are **mandatory**:

- [x] My change adheres [VictoriaMetrics contributing
guidelines](https://docs.victoriametrics.com/contributing/).

---------

Signed-off-by: Zakhar Bessarab <z.bessarab@victoriametrics.com>
Signed-off-by: hagen1778 <roman@victoriametrics.com>
Co-authored-by: hagen1778 <roman@victoriametrics.com>
(cherry picked from commit 86029de0d4)
### Describe Your Changes
- Added functionality to cancel running queries on the Explore Logs and
Query pages.
- The loader was changed from a spinner to a top bar within the block.
This still indicates loading, but solves the issue of the spinner
"flickering," especially during graph dragging.
Related issue: #7097https://github.com/user-attachments/assets/98e59aeb-905b-4b9d-bbb2-688223b22a82
### Checklist
The following checks are **mandatory**:
- [ ] My change adheres [VictoriaMetrics contributing
guidelines](https://docs.victoriametrics.com/contributing/).
(cherry picked from commit 6c9772b101)
Empty fields are treated as non-existing fields by VictoriaLogs data model.
So there is no sense in returning empty fields in query results, since they may mislead and confuse users.

(cherry picked from commit bac193e50b)
### Describe Your Changes

Related issue: #7142

### Checklist

The following checks are **mandatory**:

- [x] My change adheres [VictoriaMetrics contributing
guidelines](https://docs.victoriametrics.com/contributing/).

(cherry picked from commit c7771b1866)
### Describe Your Changes

This PR adds the feature to parse a multi yaml doc following the
`\n---\n`
The issue is
[6753](https://github.com/VictoriaMetrics/VictoriaMetrics/issues/6753)

### Checklist

The following checks are **mandatory**:

- [x] My change adheres [VictoriaMetrics contributing
guidelines](https://docs.victoriametrics.com/contributing/).

---------

Signed-off-by: kirti purohit <kirti.purohit@hpe.com>
Co-authored-by: kirti purohit <kirti.purohit@hpe.com>
Co-authored-by: Jiekun <jiekun@victoriametrics.com>
Co-authored-by: hagen1778 <roman@victoriametrics.com>
(cherry picked from commit 008b649658)
### Describe Your Changes

The flags docs mention the flag that does not exist (and never existed).
Perhaps that was a typo.

`s/retryMaxInterval/retryMaxTime/g`

### Checklist

The following checks are **mandatory**:

- [x] My change adheres [VictoriaMetrics contributing
guidelines](https://docs.victoriametrics.com/contributing/).

Signed-off-by: Artem Fetishev <rtm@victoriametrics.com>
(cherry picked from commit e2c73dc89f)
### Describe Your Changes

Add darwin `amd64` and `arm64` builds for cluster binaries build.

### Checklist

The following checks are **mandatory**:

- [x] My change adheres [VictoriaMetrics contributing
guidelines](https://docs.victoriametrics.com/contributing/).

---------

Signed-off-by: hagen1778 <roman@victoriametrics.com>
Co-authored-by: hagen1778 <roman@victoriametrics.com>
### Describe Your Changes

evalInstantRollup could have overreport the number of fetched series if
`offset` checks will result into retry. This change updates fetched
series only if these checks were successful.

It also adds a comment to another potential place of over-reporting
series fetched. It doesn't fix it, because it would require spending
extra resources on such a check, while discrepancy in seriesFetched
doesn't affect calculations in any way.

Probably related to
https://github.com/VictoriaMetrics/VictoriaMetrics/issues/7170

### Checklist

The following checks are **mandatory**:

- [x] My change adheres [VictoriaMetrics contributing
guidelines](https://docs.victoriametrics.com/contributing/).

Signed-off-by: hagen1778 <roman@victoriametrics.com>

(cherry picked from commit ebd393d8b3)
Signed-off-by: hagen1778 <roman@victoriametrics.com>
`vm_rows_ignored_total` metric is a metric for users to signalize about
ingestion issues, such as bad timestamp or parsing error.
In commit
a5424e95b3
this metric started to increment each time vmstorage gets NaN. But NaN
is a valid value for Prometheus data model and for Prometheus metrics
exposition format. Exporters from Prometheus ecosystem could expose NaNs
as values for metrics and these values will be delivered to vmstorage
and increment the metric.
Since there is nothing user can do with this, in opposite to parsing
errors or bad timestamps, there is not much sense in incrementing this
metric. So this commit rolls-back `reason="nan_value"` increments.

### Describe Your Changes

Please provide a brief description of the changes you made. Be as
specific as possible to help others understand the purpose and impact of
your modifications.

### Checklist

The following checks are **mandatory**:

- [ ] My change adheres [VictoriaMetrics contributing
guidelines](https://docs.victoriametrics.com/contributing/).

Signed-off-by: hagen1778 <roman@victoriametrics.com>

(cherry picked from commit 0d4f4b8f7d)
Signed-off-by: hagen1778 <roman@victoriametrics.com>
### Describe Your Changes

Added an ability to query data across multiple tenants. See:
https://github.com/VictoriaMetrics/VictoriaMetrics/issues/1434

Currently, the following endpoints work with multi-tenancy:
- /prometheus/api/v1/query
- /prometheus/api/v1/query_range
- /prometheus/api/v1/series
- /prometheus/api/v1/labels
- /prometheus/api/v1/label/<label_name>/values
- /prometheus/api/v1/status/active_queries
- /prometheus/api/v1/status/top_queries
- /prometheus/api/v1/status/tsdb
- /prometheus/api/v1/export
- /prometheus/api/v1/export/csv
- /vmui


A note regarding VMUI: endpoints such as `active_queries` and
`top_queries` have been updated to indicate whether query was a
single-tenant or multi-tenant, but UI needs to be updated to display
this info.
cc: @Loori-R

---------

Signed-off-by: Zakhar Bessarab <z.bessarab@victoriametrics.com>
Signed-off-by: f41gh7 <nik@victoriametrics.com>
Co-authored-by: f41gh7 <nik@victoriametrics.com>
### Describe Your Changes

Introduce the `-search.maxDeleteSeries` flag that limits the number of
time series that can be deleted with a single
`/api/v1/admin/tsdb/delete_series` call.

Currently, any number can be deleted and if the number is big (millions)
then the operation may result in unaccounted CPU and memory usage spikes
which in some cases may result in OOM kill (see #7027). The flag limits
the number to 30k by default and the users may override it if needed at
the vmstorage start time.

Related issue:
https://github.com/VictoriaMetrics/VictoriaMetrics/issues/7027
---------

Signed-off-by: Artem Fetishev <rtm@victoriametrics.com>
The change should help users to understand what happens on labels
conflict.

### Describe Your Changes

Please provide a brief description of the changes you made. Be as
specific as possible to help others understand the purpose and impact of
your modifications.

### Checklist

The following checks are **mandatory**:

- [ ] My change adheres [VictoriaMetrics contributing
guidelines](https://docs.victoriametrics.com/contributing/).

Signed-off-by: hagen1778 <roman@victoriametrics.com>
(cherry picked from commit 59bc63ebc4)
### Describe Your Changes

- Show the time range in the tooltip when hovering over staircase
graphs.
- Use bolder lines for staircase graphs.
- Increase the number of steps on the staircase graph to 100.
- Reduce the maximum width of the tooltip to 1/3 of the screen.
- Insert only the label name under the cursor into the query input field
when `Ctrl`-clicking the line legend.

See [this
comment](https://github.com/VictoriaMetrics/VictoriaMetrics/issues/6545#issuecomment-2336805237).

### Checklist

The following checks are **mandatory**:

- [ ] My change adheres [VictoriaMetrics contributing
guidelines](https://docs.victoriametrics.com/contributing/).

---------

Co-authored-by: Aliaksandr Valialkin <valyala@victoriametrics.com>
….url` using `-remoteWrite.streamAggr.dropInputLabels`

Before, labels were set to all the `remoteWrite.url`.

address https://github.com/VictoriaMetrics/VictoriaMetrics/issues/6780

---------

Co-authored-by: Roman Khavronenko <roman@victoriametrics.com>
(cherry picked from commit fbde238cdc)
### Describe Your Changes

1) Changed table settings from a popup to a modal window to simplify
future functionality additions.
2) Added functionality to save selected columns when data is modified or
the page is reloaded. See #7016.

<details>
  <summary>Example screenshots</summary>

<img alt="demo-1" width="600"
src="https://github.com/user-attachments/assets/a5d9a910-363c-4931-8b12-18ea8b3d97d8"/>

</details>

### Checklist

The following checks are **mandatory**:

- [x] My change adheres [VictoriaMetrics contributing
guidelines](https://docs.victoriametrics.com/contributing/).

---------

Co-authored-by: Roman Khavronenko <roman@victoriametrics.com>
(cherry picked from commit c896bf340d)
Use local timezone of the host server in this case. The timezone can be overridden
with TZ environment variable if needed.

While at it, allow using whitespace instead of T as a delimiter between data and time
in the ingested _time field. For example, '2024-09-20 10:20:30' is now accepted
during data ingestion. This is valid ISO8601 format, which is used by some log shippers,
so it should be supported. This format is also known as SQL datetime format.

Also assume local time zone when time without timezone information is passed to querying APIs.
Previously such a time was parsed in UTC timezone. Add `Z` to the end of the time string
if the old behaviour is preferred.

Updates https://github.com/VictoriaMetrics/VictoriaMetrics/issues/6721
### Describe Your Changes

VictoriaLogs allows logs without `_msg` field or `_msg` field is empty.
This lead to incorrect search result. See:
https://github.com/VictoriaMetrics/VictoriaMetrics/issues/6785

This pull request search for non-empty `_msg` field before log entry is
added to `LogRows`.

New counter `vl_rows_dropped_total{reason="msg_not_exist"}` is
introduced.

Example log output:
```
2024-09-23T02:33:19.719Z        warn    app/vlinsert/insertutils/common_params.go:189   dropping log line without _msg field; [{@timestamp 2024-09-18T13:42:16.600000000Z} {Attributes.array.attribute ["many","values"]} {Attributes.boolean.attribute true} {Attributes.double.attribute 637.704} {Attributes.int.attribute 10} {Attributes.map.attribute.some.map.key some value} {Attributes.string.attribute some string} {Body Example ddddddddddlog record} {Resource.service.name my.service} {Scope.my.scope.attribute some scope attribute} {Scope.name my.library} {Scope.version 1.0.0} {SeverityNumber 10} {SeverityText Information} {SpanId eee19b7ec3c1b174} {TraceFlags 0} {TraceId 5b8efff798038103d269b633813fc60c}]
```

### Checklist

The following checks are **mandatory**:

- [x] My change adheres [VictoriaMetrics contributing
guidelines](https://docs.victoriametrics.com/contributing/).
- [ ] Benchmark for potential performance loss.

---------

Co-authored-by: Aliaksandr Valialkin <valyala@victoriametrics.com>
Previously the original timestamp was used in the copied query, so _time:duration filters
were applied to the original time range: (timestamp-duration ... timestamp]. This resulted
in stopped live tailing, since new logs have timestamps bigger than the original time range.

Updates https://github.com/VictoriaMetrics/VictoriaMetrics/issues/7028
* `remoteWrite.maxQueueSize` from `100_000` to `1_000_000`, this should
improve resiliency of recording rules that produce many series;
* `remoteWrite.maxBatchSize` from `1_000` to `10_000`, this should be
more efficient to send from netwroking perspective;
* `remoteWrite.concurrency` from `1` to `4`, this should imrpove speed
of sending the generated series.

The new settings should improve remote write performance of vmalert with
default settings.

### Describe Your Changes

Please provide a brief description of the changes you made. Be as
specific as possible to help others understand the purpose and impact of
your modifications.

### Checklist

The following checks are **mandatory**:

- [ ] My change adheres [VictoriaMetrics contributing
guidelines](https://docs.victoriametrics.com/contributing/).

---------

Signed-off-by: hagen1778 <roman@victoriametrics.com>
Co-authored-by: Hui Wang <haley@victoriametrics.com>
(cherry picked from commit 6b1b47df54)
It is expected that range_first and range_last functions return non-nan const value across all the points
if the original series contains at least a single non-NaN value. Previously this rule was violated for NaN data points
in the original series. This could confuse users.

While at it, add tests for series with NaN values across all the range_* and running_* functions, in order to maintain
consistent handling of NaN values across these functions.
### Describe Your Changes

### Pull Request Description:

1. **HTML File Structure Optimization**: Adjusted the location of HTML
files for different builds to prevent redundant files in the final
output. See issue #6900
2. **Metadata Fixes**: Corrected metadata in HTML files for each build
configuration.
3. **Favicon Update**: Replaced PNG favicon (`14 KB` and `1.58 KB`) with
SVG (`1.35 KB`).
4. **Social Media Optimization**: Optimized the social preview image,
reducing its size by `60.2 KB`.
5. **Git Ignore Update**: Added `public/index.html` to `.gitignore` as
it is dynamically generated during the build process.

### Checklist

The following checks are **mandatory**:

- [x] My change adheres [VictoriaMetrics contributing
guidelines](https://docs.victoriametrics.com/contributing/).

(cherry picked from commit 4e976f66f3)
### Describe Your Changes

change the `/query_range` and `/query` requests method from `GET` to
`POST`. See #6288.

### Checklist

The following checks are **mandatory**:

- [x] My change adheres [VictoriaMetrics contributing
guidelines](https://docs.victoriametrics.com/contributing/).

---------

Signed-off-by: hagen1778 <roman@victoriametrics.com>
Co-authored-by: hagen1778 <roman@victoriametrics.com>
(cherry picked from commit b0bdb92729)
Also tried to make it catch "Authorisation" in the future, fixed a lot
of other misspells along the way, but didn't make it catch
"Authorisation" anyway.

- Fix misspelled "Authorization" header name
- Fix misspelled "organization"
- Fix more misspells
…pair

`alert_relabel_configs` in [notifier
config](https://docs.victoriametrics.com/vmalert/#notifier-configuration-file)
can drop alert labels when used to filter different tenant alert message
to different notifier.
alertmanager would report error like `msg="Failed to validate alerts"
err="at least one label pair required"` in this case, but the rest of
the alerts inside one request would still be valid in alertmanager, so
it's not severe.

(cherry picked from commit ae4d376e41)
Previously the query could return incorrect results, since the query timestamp was updated with every Query.Clone() call
during iterative search for the time range with up to limit=N rows.

While at it, optimize queries, which find low number of matching logs, while spend a lot of CPU time for searching
across big number of logs. The optimization reduces the upper bound of the time range to search if the current time range
contains zero matching rows.

Updates https://github.com/VictoriaMetrics/VictoriaMetrics/issues/6785
### Describe Your Changes

Add storage metrics that count records that failed to insert:

- `RowsReceivedTotal`: the number of records that have been received by
the storage from the clients
- `RowsAddedTotal`: the number of records that have actually been
persisted. This value must be equal to `RowsReceivedTotal` if all the
records have been valid ones. But it will be smaller otherwise. The
values of the metrics below should provide the insight of why some
records hasn't been added
-   `NaNValueRows`: the number of records whose value was `NaN`
- `StaleNaNValueRows`: the number of records whose value was `Stale NaN`
- `InvalidRawMetricNames`: the number of records whose raw metric name
has failed to unmarshal.

The following metrics existed before this PR and are listed here for
completeness:

- `TooSmallTimestampRows`: the number of records whose timestamp is
negative or is older than retention period
- `TooBigTimestampRows`: the number of records whose timestamp is too
far in the future.
- `HourlySeriesLimitRowsDropped`: the number of records that have not
been added because the hourly series limit has been exceeded.
- `DailySeriesLimitRowsDropped`: the number of records that have not
been added because the daily series limit has been exceeded.

---
Signed-off-by: Artem Fetishev <wwctrsrx@gmail.com>
Commit adds the following changes:

* Adds support of OpenTelemetry logs for Victoria Logs with protobuf encoded messages

*  json encoding is not supported for the following reasons:
   - It brings a lot of fragile code, which works inefficiently.
   - json encoding is impossible to use with language SDK.

* splits metrics and logs structures at lib/protoparser/opentelemetry/pb package.

* adds docs with examples for opentelemetry logs.

---
Related issue: https://github.com/VictoriaMetrics/VictoriaMetrics/issues/4839

Co-authored-by: AndrewChubatiuk <andrew.chubatiuk@gmail.com>
Co-authored-by: f41gh7 <nik@victoriametrics.com>
* updates change log
* adds VL-Debug http header
* updates doc
* extracts only the first value of http headers for VL-Stream-Fields and VL-Ignore-Fields.
  It makes behaviour the same as Query string args. And allows to easily configure client applications.
  Since most of the client collectors don't support multi value headers.

Signed-off-by: f41gh7 <nik@victoriametrics.com>
*  Many collectors don't support forwarding url query params to the remote system. It makes impossible to define stream fields for it. Workaround with proxy between VictoriaLogs and log shipper is too complicated solution.

* This commit adds the following changes:
 * Adds fallback to to headers params, if query param is empty for:
     _msg_field -> VL-Msg-Field
    _stream_fields -> VL-Stream-Fields
    _ignore_fields -> VL-Ignore-Fields
    _time_field -> VL-Time-Field
 * removes deprecations from victorialogs compose files, added more
output format examples for logstash, telegraf, fluent-bit

 related issue: https://github.com/VictoriaMetrics/VictoriaMetrics/issues/5310
Recent versions of `docker build` started generating the InvalidDefaultArgInFrom warning if Dockerfile contains
an ARG without default value. While this warning doesn't affect building Docker packages via `make package-*` commands,
it is better suppressing the warning, so it doesn't clutter `make package-*` output with the noise,
which can hide real issues in the future.
…specifying `-streamAggr.dedupInterval` or
`-remoteWrite.streamAggr.dedupInterval` command-line flag

[The
documentation](https://docs.victoriametrics.com/stream-aggregation/)
contains conflicting descriptions regarding deduplication for
non-matched series when `-remoteWrite.streamAggr.config` and / or
`-streamAggr.config` are set:
1. Statement below says **all the received data** is deduplicated:
>[vmagent](https://docs.victoriametrics.com/vmagent/) supports
relabeling, deduplication and stream aggregation for all the received
data, scraped or pushed. Then, the collected data will be forwarded to
specified -remoteWrite.url destinations. The data processing order is
the following:
>1. all the received data is relabeled according to the specified
[-remoteWrite.relabelConfig](https://docs.victoriametrics.com/vmagent/#relabeling)
(if it is set)
>2. all the received data is deduplicated according to specified
[-streamAggr.dedupInterval](https://docs.victoriametrics.com/stream-aggregation/#deduplication)
(if it is set to duration bigger than 0)

2. Another statement says the deduplication is performed individually
for the **matching samples**
>The de-deduplication is performed after applying
[relabeling](https://docs.victoriametrics.com/vmagent/#relabeling) and
before performing the aggregation. If the -remoteWrite.streamAggr.config
and / or -streamAggr.config is set, then the de-duplication is performed
individually per each [stream aggregation
config](https://docs.victoriametrics.com/stream-aggregation/#stream-aggregation-config)
for the matching samples after applying
[input_relabel_configs](https://docs.victoriametrics.com/stream-aggregation/#relabeling).

Considering the following deduplication use cases:
1. To apply deduplication(globally or for specific remoteWrite
destination) for all the received data, scraped or pushed
--- using `-streamAggr.dedupInterval` or
`-remoteWrite.streamAggr.dedupInterval`.
2. To deduplicate and aggregate metrics that match the rule `match`
filters
--- using `-remoteWrite.streamAggr.config` and specifiying
`dedup_interval` option in [stream aggregation
config](https://docs.victoriametrics.com/stream-aggregation/#stream-aggregation-config).
3. To deduplicate all the received data while having `streamAggr.config`
for some metrics
--- no way for a single vmagent now, need to set up two level vmagents

This PR implements case3.

---------

Co-authored-by: Roman Khavronenko <roman@victoriametrics.com>
(cherry picked from commit d523015f27)
add command-line flag `-search.inmemoryBufSizeBytes` for configuring size of in-memory buffers used by vmselect during processing of vmstorage responses. A new summary metric `vm_tmp_blocks_inmemory_file_size_bytes` is exposed to show the size of the buffer during requests processing.

The new setting can be used by experienced users to adjust memory usage by vmselect when processing
many small read requests. Instead of allocating 4MB buffers each time, vmselect can be instructed to lower
the buffer size via `-search.inmemoryBufSizeBytes`. To make the decision whether this flag needs to be adjusted
users can consult with `vm_tmp_blocks_inmemory_file_size_bytes` which shows the actual size of buffers used
during query processing.

----------

The detailed information of this PR can be found in
https://github.com/VictoriaMetrics/VictoriaMetrics/pull/6851

### Checklist

The following checks are **mandatory**:

- [ ] My change adheres [VictoriaMetrics contributing
guidelines](https://docs.victoriametrics.com/contributing/).

---------

Co-authored-by: hagen1778 <roman@victoriametrics.com>
## Describe Your Changes
Add RemoteWrite Retry Controls
This PR introduces two new flags to the remote write functionality:
- remoteWrite.retryMinInterval
- remoteWrite.retryMaxTime
These flags provide finer control over the retry behavior for
remoteWrite operations, allowing users to customize the minimum interval
between retries and the maximum duration for retry attempts.
Fixes#5486.
## Checklist
- [x] The following checks are mandatory:
My change adheres [VictoriaMetrics contributing
guidelines](https://docs.victoriametrics.com/contributing/).
---------
Signed-off-by: Yury Akudovich <ya@matterlabs.dev>
Co-authored-by: hagen1778 <roman@victoriametrics.com>
(cherry picked from commit d0f5a9d77a)
This change is made in attempt to reduce memory usage by vmalert when
parsing big instant responses from VM/Prometheus.

In
a5c427bac4
vmalert switched from std json lib to fastjson lib in order to reduce
amount of allocations, as according to highloaded profiles of vmalert
the CPU is mostly spent on GC.

But switching to fastjson resulted into excessive memory usage for cases
when vmalert has to parse long json lines, which usually happens when
instant response contains many `metric` objects.

In this change we do a mixed parsing:
1. Slice of `metric` objects is parsed with std lib to keep mem low
2. Each `metric` object is parsed with fastjson to reduce allocs

The benchmark results are the following:
```
pkg: github.com/VictoriaMetrics/VictoriaMetrics/app/vmalert/datasource
BenchmarkParsePrometheusResponse/Instant_std+fastjson-10                    1760            668959 ns/op          280147 B/op       5781 allocs/op
MBs allocated at heap: 493.078392
mallocs: 18655472
BenchmarkParsePrometheusResponse/Instant_fastjson-10                        6109            198258 ns/op          172839 B/op       5548 allocs/op
MBs allocated at heap: 1056.384464
mallocs: 34457184
BenchmarkParsePrometheusResponse/Instant_std-10                             1287            950987 ns/op          451677 B/op       9619 allocs/op
MBs allocated at heap: 580.802976
mallocs: 13351636
```
The benchmark function code with mem measurement is available here
https://gist.github.com/hagen1778/b9c3ca7f8ca7d6b21aec9777112c5810

The benchmark contains 3 results:
1. Instant_std+fastjson is the implementation in this change
2. Instant_fastjson-10 is the implementation from
a5c427bac4
3. BenchmarkParsePrometheusResponse/Instant_std-10 is implementation
before
a5c427bac4

According to these results, this new implementation is slower than
previous, but faster than before switching to fastjson. It also has
lower number of allocations and roughly the same memory allocation on
heap with GC turned off.

---------

Other changes:
1. rm BenchmarkMetrics as it doesn't measure anything
2. simplify BenchmarkParsePrometheusResponse into
BenchmarkPromInstantUnmarshal

### Describe Your Changes

Please provide a brief description of the changes you made. Be as
specific as possible to help others understand the purpose and impact of
your modifications.

### Checklist

The following checks are **mandatory**:

- [ ] My change adheres [VictoriaMetrics contributing
guidelines](https://docs.victoriametrics.com/contributing/).

Signed-off-by: hagen1778 <roman@victoriametrics.com>
- fix TS lint
- anomaly: remove /vmui
- anomaly: minor inspections fix
- docs: fix broken links to headings

### Describe Your Changes

Initially vmanomaly opened with `/vmui` in serverUrl, remove it.

(cherry picked from commit 535a9ed059)
to allow configuring additional headers in each request to the
corresponding notifier.
Other flags like `-datasource.headers`, `-remoteWrite.headers` already
use `^^` as delimiter, it's consistent to use it in `-notifier.headers`
as well.

related https://github.com/VictoriaMetrics/VictoriaMetrics/issues/3260
vmalert can integrate with alertmanager that supports multi-tenant by
adding tenantID header`X-Scope-OrgID` in requests.
In multitenancy, vmalert can also filter alerts which send to different
notifier addresses(or with different header settings) using
`alert_relabel_configs`.

Updates https://github.com/VictoriaMetrics/VictoriaMetrics/issues/3260

---------

Signed-off-by: hagen1778 <roman@victoriametrics.com>
Co-authored-by: hagen1778 <roman@victoriametrics.com>
(cherry picked from commit 0f1ec33892)
Production workload shows that it's useful optimisation.

Channel based objects pool allows to handle irregural data ingestion
requests and make memory allocations more smooth.
It's improves sync.Pool efficiency, since objects from sync.Pool removed
after 2 GC cycles. With GOGC=30 value, GC runs significantly more often.

https://github.com/VictoriaMetrics/VictoriaMetrics/issues/6733

### Checklist

The following checks are **mandatory**:

- [ ] My change adheres [VictoriaMetrics contributing
guidelines](https://docs.victoriametrics.com/contributing/).

---------

Signed-off-by: f41gh7 <nik@victoriametrics.com>
Signed-off-by: hagen1778 <roman@victoriametrics.com>
Co-authored-by: hagen1778 <roman@victoriametrics.com>
Describe Your Changes
When I use usePromCompatibleNaming with vmagent to process data that
needs to be formatted from different sources such as InfluxDB, I find
that it doesn’t work

However, it works in vminsert. I found that vminsert uses the
HasRelabeling method to determine whether to relabel.
```go
func HasRelabeling() bool {
	pcs := pcsGlobal.Load()
	return pcs.Len() > 0 || *usePromCompatibleNaming
}
```
in vmagent, the decision to relabel is determined only by
pcsGlobal.Len() > 0. However, in the applyRelabeling method, the
usePromCompatibleNaming logic is also used to determine whether to
relabel in the error handling.
```go
func (rctx *relabelCtx) applyRelabeling(tss []prompbmarshal.TimeSeries, pcs *promrelabel.ParsedConfigs) []prompbmarshal.TimeSeries {
	if pcs.Len() == 0 && !*usePromCompatibleNaming {
		// Nothing to change.
		return tss
	}
```
So I think that the logic for determining whether to relabel in vmagent
is not as expected.

Checklist
The following checks are mandatory:

[✅]My change adheres [VictoriaMetrics contributing
guidelines](https://docs.victoriametrics.com/contributing/).

---------

Co-authored-by: Roman Khavronenko <hagen1778@gmail.com>
(cherry picked from commit d134a310f3)
vmselect will create `./tmp` dir under `cacheDataPath`. If
`cacheDataPath` is set to `/`, vmselect will use `/tmp`.

content under `/tmp` dir might be auto removed based on the OS
behaviour. See:
https://github.com/VictoriaMetrics/VictoriaMetrics/issues/5770

- [x] My change adheres [VictoriaMetrics contributing
guidelines](https://docs.victoriametrics.com/contributing/).

---------

Signed-off-by: hagen1778 <roman@victoriametrics.com>
Co-authored-by: hagen1778 <roman@victoriametrics.com>
…eep_metric_names` options in stream aggregation config together

With aggregated data and raw data under the same metric, results would
be confusing.

---------

Signed-off-by: hagen1778 <roman@victoriametrics.com>
Co-authored-by: hagen1778 <roman@victoriametrics.com>
(cherry picked from commit 62d19369a3)
VM has different responses to equivalent queries for MetricsQL and
GraphiteQL in case of failed access to one of vmstorage node of the
cluster vmstorage nodes. For GraphiteQL, the denyPartialResponse feature
is not used, it is always true, which is not always correct (depending
on the configuration).

In the PR I have removed the hardcoded denyPartialResponse for
GraphiteQL, just like MetricsQL does.

- [x] My change adheres [VictoriaMetrics contributing
guidelines](https://docs.victoriametrics.com/contributing/).
Make `-remoteWrite.streamAggr.ignoreFirstIntervals` of array type so it could
 accept multiple values which can be applied to the corresponding`-remoteWrite.url`.

---------

Signed-off-by: hagen1778 <roman@victoriametrics.com>
Co-authored-by: hagen1778 <roman@victoriametrics.com>
(cherry picked from commit 8f5c26d788)
Fix `-streamAggr.dropInputLabels` behavior  when global deduplication is enabled without `-streamAggr.config`.
Previously, `-remoteWrite.streamAggr.dropInputLabels` is misapplied.

---------

Signed-off-by: hagen1778 <roman@victoriametrics.com>
Co-authored-by: hagen1778 <roman@victoriametrics.com>
(cherry picked from commit 4863605469)
The error check was needed before a84491324d
It was kept by mistake and makes no sense to have rn.

Signed-off-by: hagen1778 <roman@victoriametrics.com>
(cherry picked from commit 9726e6c1a2)
### Describe Your Changes

- Adds support for displaying the top 5 log streams in the hits graph,
grouping the remaining streams into an "other" label.
   #6545

- Adds options to customize the graph display with bar, line, stepped
line, and points views.

### Checklist

The following checks are **mandatory**:

- [x] My change adheres [VictoriaMetrics contributing
guidelines](https://docs.victoriametrics.com/contributing/).

(cherry picked from commit 04c2232e45)
### Describe Your Changes

This is useful for clients which validate InfluxDB is available before
data ingestion can be started.

See: https://github.com/VictoriaMetrics/VictoriaMetrics/issues/6653

### Checklist

The following checks are **mandatory**:

- [x] My change adheres [VictoriaMetrics contributing
guidelines](https://docs.victoriametrics.com/contributing/).

---------

Signed-off-by: Zakhar Bessarab <z.bessarab@victoriametrics.com>
Signed-off-by: hagen1778 <roman@victoriametrics.com>
Co-authored-by: hagen1778 <roman@victoriametrics.com>

(cherry picked from commit 9877a5e7d5)
Signed-off-by: hagen1778 <roman@victoriametrics.com>