While at at, allow passing an array of string values per each JSON entry at extra_filters and extra_stream_filters.
For example, `extra_filters={"foo":["bar","baz"]}` is converted into `foo:in("bar", "baz")` extra filter,
while `extra_stream_fitlers={"foo":["bar","baz"]}` is converted into `{foo=~"bar|baz"}` extra filter.

This should simplify creating faceted search when multiple values per a single log field must be selected.
This is needed for https://github.com/VictoriaMetrics/VictoriaMetrics/issues/7365#issuecomment-2447964259

Updates https://github.com/VictoriaMetrics/VictoriaMetrics/issues/5542
Such log fields do not give any useful information during logs' exploration.
They just clutter the output of the `facets` pipe. So it is better to drop such fields by default.

If these fields are needed, then `keep_const_fields` option can be added to `facets` pipe.
- Remove Loki sink, since it brings more troubles when users try using it in Vector.
  For example, it encodes all the log fields as a JSON string and puts it into "message" field.
  This results in storing the "message" field with the JSON string containing all the log fields
  in VictoriaLogs. This is not what expected - every log field must be stored as a separate field
  according to https://docs.victoriametrics.com/victorialogs/keyconcepts/

- Remove 'mode: bulk' option from Elasticsearch sink configuration, since this option is set by default to this value,
  so there is no need in explicit setting.

- Add 'compression: gzip' to all the config examples, since the compression reduces the used network bandwidth by 4-5 times,
  while it doesn't increase CPU usage too much at both Vector and VictoriaLogs sides. So it is better to enable the compression in config examples.

- Mention about HTTP parameters accepted by VictoriaLogs data ingestion APIs in both examples for Elasticsearch and JSON line protocols.
### Describe Your Changes

rfc5424 doesn't allow structured data to be started from whitespace, but
it can be present in the end of this section
related issue
https://github.com/VictoriaMetrics/VictoriaMetrics/issues/7776

### Checklist

The following checks are **mandatory**:

- [ ] My change adheres [VictoriaMetrics contributing
guidelines](https://docs.victoriametrics.com/contributing/).

---------

Co-authored-by: Roman Khavronenko <roman@victoriametrics.com>
This function calculates the number of unique value hashes. This number is a good approximation
for the number of unique values. The `count_uniq_hash` function uses less memory and works faster
than `count_uniq` when applied to fields with big number of unique values.
The panic may occur when the surrounding logs for some original log entry are empty.
This is possible when these logs were included into surrounding logs for the previous original log entry.

Updates https://github.com/VictoriaMetrics/VictoriaMetrics/issues/7762
The following patterns are detected:

- `<N>-<N>-<N>-<N>-<N>` is replaced with `<UUID>`.
- `<N>.<N>.<N>.<N>` is replaced with `<IP4>`.
- `<N>:<N>:<N>` is replaced with `<TIME>`. Optional fractional seconds after the time are treated as a part of `<TIME>`.
- `<N>-<N>-<N>` and `<N>/<N>/<N>` is replaced with `<DATE>`.
- `<N>-<N>-<N>T<N>:<N>:<N>` and `<N>-<N>-<N> <N>:<N>:<N>` is replaced with `<DATETIME>`. Optional timezone after the datetime is treated as a part of `<DATETIME>`.
This is useful for detecting patterns across log messages, which differ by various numeric fields,
with the following query:

_time:1h | collapse_nums | top 10 by (_msg)
The max_value_len query arg allows controlling the maximum length of values
per every log field. If the length is exceeded, then the log field is dropped
from the results, since it contains incomplete (misleading) set of most frequently seen field values.
`stream_context` is implemented in the way, which needs scanning all the logs for the selected log streams.
The scan performance is usually fast, since the majority of blocks are skipped, since they do not contain
rows with the needed timestamps. But there was a pathological case with `stream_context before N`:

VictoriaLogs usually scans blocks in chronological order. That means that the `before` context logs are constantly
updated with the new logs. This requires reading the actual data for the requested log fields from disk.
The workaround is to split the process of obtaining stream context logs into two phases:

1. Select only timestamps for the stream context logs, whithout selecting other log fields.
   This operation is usually much faster than reading the requested log fields.

2. Select stream context logs for the selected timestamps. This operation is usually fast,
   since the requested number of context logs is usually not so big.

Performance testing for the new algorithm shows up to 30x speed improvement for `stream_context before N`
and up to 5x speed improvement for `stream_context after N` when applied to log stream with 50M logs.

Updates https://github.com/VictoriaMetrics/VictoriaMetrics/issues/7637
This endpoint returns the most frequent values per each field seen in the selected logs.
This endpoint is going to be used by VictoriaLogs web UI for faceted search.
Previously such expressions were improperly formatted, which could result
in incorrect calculations at vlogscli.

For example, 'x / (y / z)' was formatted as 'x / y / z',
while 'x - (y + z)' was formatted as 'x - y + z'.
`top` pipe can be confused with the `first` and `last` pipes, so add references to these pipes from the `top` pipe docs.
This should help users locating the needed pipes.
The `first N by (field)` pipe is a shorthand to `sort by (field) limit N`,
while the `last N by (field)` pipe is a shorthand to `sort by (field) desc limit N`.

While at it, add support for partitioning sort results by log groups and applying
individual limit per each group.

For example, the following query returns up to 3 logs per each host with the biggest value
for the `request_duration` field:

_time:5m | last 3 by (request_duration) partition by (host)

This query is equivalent to the following one:

_time:5m | sort by (request_duration) desc limit 3 partition by (host)

Automatically add the 'partition by (_time)` into `sort`, `first` and `last` pipes
used in the query to `/select/logsql/stats_query_range` API.
This is needed for https://github.com/VictoriaMetrics/VictoriaMetrics/issues/7699
Previously Block columns wasn't properly limited by maxColumnsPerBlock.
And it was possible a case, when more columns per block added than
expected.
 For example, if ingested log stream has many unuqie fields
and it's sum exceed maxColumnsPerBlock.
 We only enforce fieldsPerBlock limit during row parsing, which limits
isn't enough to mitigate this issue. Also it
would be very expensive to apply maxColumnsPerBlock limit during
ingestion, since it requires to track all possible field tags
combinations.

 This commit adds check for maxColumnsPerBlock limit during
MustInitFromRows function call. And it returns offset of the rows and
timestamps added to the block.
 Function caller must create another block and ingest remaining rows
into it.

Related issue:
https://github.com/VictoriaMetrics/VictoriaMetrics/issues/7568

### Describe Your Changes

Please provide a brief description of the changes you made. Be as
specific as possible to help others understand the purpose and impact of
your modifications.

### Checklist

The following checks are **mandatory**:

- [ ] My change adheres [VictoriaMetrics contributing
guidelines](https://docs.victoriametrics.com/contributing/).

---------

Signed-off-by: f41gh7 <nik@victoriametrics.com>
Co-authored-by: Aliaksandr Valialkin <valyala@victoriametrics.com>
This metric tracks an approximate amounts of bytes processed when parsing the ingested logs.
The metric is exposed individually per every supported data ingestion protocol. The protocol name
is exposed via "type" label in order to be consistent with vl_rows_ingested_total metric.

Thanks to @tenmozes for the initial idea and implementation at https://github.com/VictoriaMetrics/VictoriaMetrics/pull/7682

While at it, remove the unneeded "format" label from vl_rows_ingested_total metric.
The "type" label must be enough for encoding the data ingestion format.
### Describe Your Changes

- Fixes the handling of the `showLegend` flag.
- Fixes the handling of `alias`.
- Adds support for alias templates, allowing dynamic substitutions like
`{{label_name}}`.

Related issue:
https://github.com/VictoriaMetrics/VictoriaMetrics/issues/7565
### Describe Your Changes

- **Memory Optimization**: Reduced memory consumption on the "Group" and
"JSON" tabs by approximately 30%.

- **Table Pagination**: Added pagination to the "Table" view with an
option to select the number of rows displayed (from 10 to 1000 items per
page, with a default of 1000). This change significantly reduced memory
usage by approximately 75%.

Related to #7185

### Checklist

The following checks are **mandatory**:

- [ ] My change adheres [VictoriaMetrics contributing
guidelines](https://docs.victoriametrics.com/contributing/).

---------

Co-authored-by: Roman Khavronenko <roman@victoriametrics.com>
Previously, when the alert got resolved shortly before the vmalert
process shuts down, this could result in false alerts.

This change switches vmalert to use MetricsQL function during alerts state restore, which makes it
incompatible for state restoration with PromQL.

---------

Co-authored-by: Roman Khavronenko <roman@victoriametrics.com>
### Describe Your Changes

Please provide a brief description of the changes you made. Be as
specific as possible to help others understand the purpose and impact of
your modifications.

### Checklist

The following checks are **mandatory**:

- [ ] My change adheres [VictoriaMetrics contributing
guidelines](https://docs.victoriametrics.com/contributing/).

Signed-off-by: hagen1778 <roman@victoriametrics.com>
- The --delete option is needed to be passed to rsync during backups,
Since otherwise the backup may contain superfluous files after the second run of rsync,
because these files can be already removed at the source because of background merge

- the --delete option is needed when restoring from backup in order to remove superfluous files
from the destination directory. Otherwise these files may lead to inconsistent data at VictoriaLogs.
By default the delay equals to 1 second.

While at it, document refresh_interval query arg at /select/logsql/tail endpoint.

Thanks to @Fusl for the idea and the initial implementation at https://github.com/VictoriaMetrics/VictoriaMetrics/pull/7428
### Describe Your Changes

add sorting of logs by groups and within each group by time in desc
order. See #7184 and #7045

### Checklist

The following checks are **mandatory**:

- [ ] My change adheres [VictoriaMetrics contributing
guidelines](https://docs.victoriametrics.com/contributing/).

Co-authored-by: Aliaksandr Valialkin <valyala@victoriametrics.com>
Loki protocol supports optional `metadata` object for each ingested line. It's added as 3rd field at the (ts,msg,metadata) tuple. Previously,  loki request json parsers rejected log line if tuple size != 2.

This commit allows optional tuple field. It parses it as json object and adds it as log metadata fields to the  log message stream.


related issue:
https://github.com/VictoriaMetrics/VictoriaMetrics/issues/7431

---------
Co-authored-by: f41gh7 <nik@victoriametrics.com>
User experience suggests that examples shouldn't have `-rule.defaultRuleType=vlogs` set,
as it may confuse users who run vmalert with their existing rules or only use
rules from examples for testing purposes.

This change is supposed to remove the confusion by removing `-rule.defaultRuleType=vlogs`
from default recommendations and explcitily specifying `type` on group level in examples.

Signed-off-by: hagen1778 <roman@victoriametrics.com>
* fix typos in rules definition. Otherwise, they can't pass validation
* add code types for rendered examples

### Describe Your Changes

Please provide a brief description of the changes you made. Be as
specific as possible to help others understand the purpose and impact of
your modifications.

### Checklist

The following checks are **mandatory**:

- [ ] My change adheres [VictoriaMetrics contributing
guidelines](https://docs.victoriametrics.com/contributing/).

Signed-off-by: hagen1778 <roman@victoriametrics.com>
This commit adds the following changes:

- Added support to push datadog logs with examples of how to ingest data
using Vector and Fluentbit
- Updated VictoriaLogs examples directory structure to have single
container image for victorialogs, agent (fluentbit, vector, etc) but
multiple configurations for different protocols

Related issue https://github.com/VictoriaMetrics/VictoriaMetrics/issues/6632
### Describe Your Changes

Christmas is early and you get the first present in the shape of
spelling fixes.
Sorry for the big amount :)

### Checklist

- [x] My change adheres [VictoriaMetrics contributing
guidelines](https://docs.victoriametrics.com/contributing/).
In this case the _msg field is set to the value specified in the -defaultMsgValue command-line flag.

This should simplify first-time migration to VictoriaLogs from other systems.
- Remove leading whitespace from the first lines in 'HTTP parameters' chapter.
  This whitespace isn't needed for the markdown formatting.

- Add leading whitespace for the second sentence in the list bullet describing AccountID and ProjectID HTTP headers.
  This fixes markdown formatting for this list bullet.
This msy be useful when ingesting logs from different sources, which store the log message in different fields.
For example, `_msg_field=message,event.data,some_field` will get log message from the first non-empty field:
`message`, `event.data` and `some_field`.
If the number of output (bloom, values) shards is zero, then this may lead to panic
as shown at https://github.com/VictoriaMetrics/VictoriaMetrics/issues/7391 .

This panic may happen when parts with only constant fields with distinct values are merged into
output part with non-constant fields, which should be written to (bloom, values) shards.
This allows reducing the amounts of data, which must be read during queries over logs with big number of fields (aka "wide events").
This, in turn, improves query performance when the data, which needs to be scanned during the query, doesn't fit OS page cache.
This improves performance of `field_values` pipe when it is applied to large number of data blocks.
This also improves performance of /select/logsql/field_values HTTP API.
### Describe Your Changes

Fixes issues with incorrect updating of query and limit fields, and
resolves the problem where the display tab resets.

Related issue: #7279 and #7290

### Checklist

The following checks are **mandatory**:

- [ ] My change adheres [VictoriaMetrics contributing
guidelines](https://docs.victoriametrics.com/contributing/).

---------

Signed-off-by: hagen1778 <roman@victoriametrics.com>
Co-authored-by: Zakhar Bessarab <z.bessarab@victoriametrics.com>
### Describe Your Changes
**Added ability to hide the hits chart**
- Users can now hide or show the hits chart by clicking the "eye" icon
located in the upper-right corner of the chart.
- When the chart is hidden, it will stop sending requests to
`/select/logsql/hits`.
- Upon displaying the chart again, it will automatically refresh. If a
relative time range is set, the chart will update according to the time
period of the logs currently being displayed.
**Hits chart visible:**
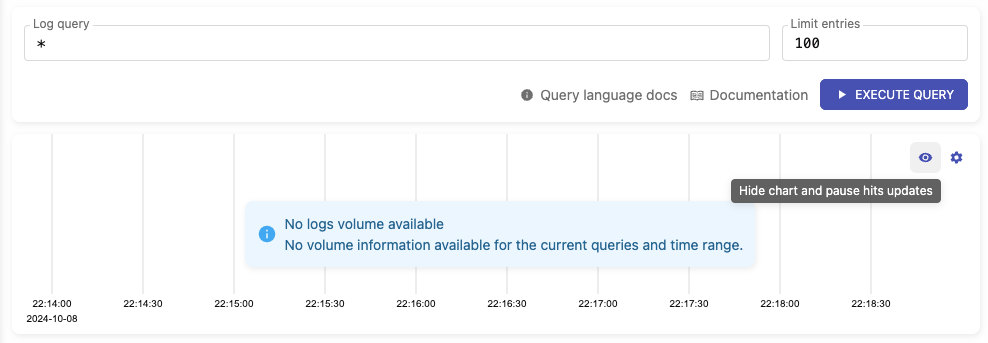
**Hits chart hidden:**

Related issue: #7117
### Checklist
The following checks are **mandatory**:
- [ ] My change adheres [VictoriaMetrics contributing
guidelines](https://docs.victoriametrics.com/contributing/).
Co-authored-by: Aliaksandr Valialkin <valyala@victoriametrics.com>
### Describe Your Changes

Fixed the display of hits chart in VictoriaLogs.
See #7133

### Checklist

The following checks are **mandatory**:

- [ ] My change adheres [VictoriaMetrics contributing
guidelines](https://docs.victoriametrics.com/contributing/).
Unpack the full columnsHeader block instead of unpacking meta-information per each individual column
when the query, which selects all the columns, is executed. This improves performance when scanning
logs with big number of fields.
- Use parallel merge of per-CPU shard results. This improves merge performance on multi-CPU systems.
- Use topN heap sort of per-shard results. This improves performance when results contain millions of entries.
1. Verify if field in [fields
pipe](https://docs.victoriametrics.com/victorialogs/logsql/#fields-pipe)
exists. If not, it generates a metric with illegal float value "" for
prometheus metrics protocol.
2. check if multiple time range filters produce conflicted query time
range, for instance:
```
query: _time: 5m | stats count(),
start:2024-10-08T10:00:00.806Z,
end: 2024-10-08T12:00:00.806Z,
time: 2024-10-10T10:02:59.806Z
```
must give no result due to invalid final time range.

---------

Co-authored-by: Aliaksandr Valialkin <valyala@victoriametrics.com>
It has been appeared that VictoriaLogs is frequently used for collecting logs with tens of fields.
For example, standard Kuberntes setup on top of Filebeat generates more than 20 fields per each log.
Such logs are also known as "wide events".

The previous storage format was optimized for logs with a few fields. When at least a single field
was referenced in the query, then the all the meta-information about all the log fields was unpacked
and parsed per each scanned block during the query. This could require a lot of additional disk IO
and CPU time when logs contain many fields. Resolve this issue by providing an (field -> metainfo_offset)
index per each field in every data block. This index allows reading and extracting only the needed
metainfo for fields used in the query. This index is stored in columnsHeaderIndexFilename ( columns_header_index.bin ).
This allows increasing performance for queries over wide events by 10x and more.

Another issue was that the data for bloom filters and field values across all the log fields except of _msg
was intermixed in two files - fieldBloomFilename ( field_bloom.bin ) and fieldValuesFilename ( field_values.bin ).
This could result in huge disk read IO overhead when some small field was referred in the query,
since the Operating System usually reads more data than requested. It reads the data from disk
in at least 4KiB blocks (usually the block size is much bigger in the range 64KiB - 512KiB).
So, if 512-byte bloom filter or values' block is read from the file, then the Operating System
reads up to 512KiB of data from disk, which results in 1000x disk read IO overhead. This overhead isn't visible
for recently accessed data, since this data is usually stored in RAM (aka Operating System page cache),
but this overhead may become very annoying when performing the query over large volumes of data
which isn't present in OS page cache.

The solution for this issue is to split bloom filters and field values across multiple shards.
This reduces the worst-case disk read IO overhead by at least Nx where N is the number of shards,
while the disk read IO overhead is completely removed in best case when the number of columns doesn't exceed N.
Currently the number of shards is 8 - see bloomValuesShardsCount . This solution increases
performance for queries over large volumes of newly ingested data by up to 1000x.

The new storage format is versioned as v1, while the old storage format is version as v0.
It is stored in the partHeader.FormatVersion.

Parts with the old storage format are converted into parts with the new storage format during background merge.
It is possible to force merge by querying /internal/force_merge HTTP endpoint - see https://docs.victoriametrics.com/victorialogs/#forced-merge .
### Describe Your Changes

Fix `Alert` component to prevent it from overflowing the screen when
displaying long messages.

Related issue: #7207

### Checklist

The following checks are **mandatory**:

- [x] My change adheres [VictoriaMetrics contributing
guidelines](https://docs.victoriametrics.com/contributing/).

---------

Signed-off-by: Zakhar Bessarab <z.bessarab@victoriametrics.com>
Signed-off-by: hagen1778 <roman@victoriametrics.com>
Co-authored-by: hagen1778 <roman@victoriametrics.com>
### Describe Your Changes
- Added functionality to cancel running queries on the Explore Logs and
Query pages.
- The loader was changed from a spinner to a top bar within the block.
This still indicates loading, but solves the issue of the spinner
"flickering," especially during graph dragging.
Related issue: #7097https://github.com/user-attachments/assets/98e59aeb-905b-4b9d-bbb2-688223b22a82
### Checklist
The following checks are **mandatory**:
- [ ] My change adheres [VictoriaMetrics contributing
guidelines](https://docs.victoriametrics.com/contributing/).
Empty fields are treated as non-existing fields by VictoriaLogs data model.
So there is no sense in returning empty fields in query results, since they may mislead and confuse users.
### Describe Your Changes

Fixed VictoriaLogs HA examples references in docs

### Checklist

The following checks are **mandatory**:

- [ ] My change adheres [VictoriaMetrics contributing
guidelines](https://docs.victoriametrics.com/contributing/).
s.partitions can be changed when new partition is registered or when old partition is dropped.
This could lead to data races and panics when s.partitions slice is accessed by concurrently executed queries.

The fix is to make a copy of the selected partitions under s.partitionsLock before performing the query.
### Describe Your Changes

Please provide a brief description of the changes you made. Be as
specific as possible to help others understand the purpose and impact of
your modifications.

### Checklist

The following checks are **mandatory**:

- [ ] My change adheres [VictoriaMetrics contributing
guidelines](https://docs.victoriametrics.com/contributing/).

Signed-off-by: Zakhar Bessarab <z.bessarab@victoriametrics.com>
### Describe Your Changes

Please provide a brief description of the changes you made. Be as
specific as possible to help others understand the purpose and impact of
your modifications.

### Checklist

The following checks are **mandatory**:

- [x] My change adheres [VictoriaMetrics contributing
guidelines](https://docs.victoriametrics.com/contributing/).
Create blockResultColumn.forEachDictValue* helper functions for visiting matching
dictionary values. These helper functions should prevent from counting dictionary values
without matching logs in the future.

This is a follow-up for 0c0f013a60
Updates https://github.com/VictoriaMetrics/VictoriaMetrics/issues/7152
encoding.GetUint64s() returns uninitialized slice, which may contain arbitrary values.
So values in this slice must be reset to zero before using it for counting hits in `uniq` and `top` pipes.
This allows executing queries with `stats` pipe, which calculate multiple results with the same functions,
but with different `if (...)` conditions. For example:

  _time:5m | count(), count() if (error)

Previously such queries couldn't be executed becasue automatically generated name for the second result
didn't include `if (error)`, so names for both results were identical - `count(*)`.
Now the following queries are equivalents:

    _time:5s | sort by (_time)

    _time:5s | order by (_time)

This is needed for convenience, since `order by` is commonly used in other query languages such as SQL.
### Describe Your Changes

Marked fluentd in victorialogs roadmap
Added fluentd syslog example setup

### Checklist

The following checks are **mandatory**:

- [ ] My change adheres [VictoriaMetrics contributing
guidelines](https://docs.victoriametrics.com/contributing/).